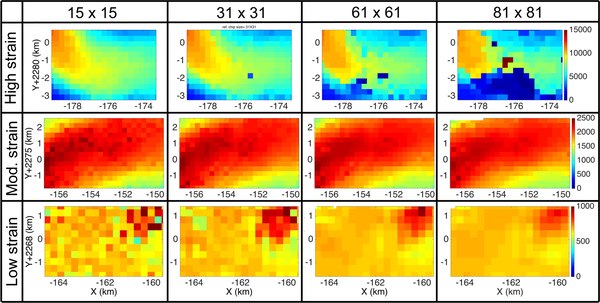
Fig.12.
Results from multiple matching over regions of differing shear strain rate with differing reference chip sizes. Each row is results from the high, moderate and low strain areas shown in Fig.11, box 1,2, and 3 respectively. Each column is the result obtained using reference chip sizes of 15 by 15, 31 by 31, 61 by 61 and 81 by 81 pixels, respectively.

