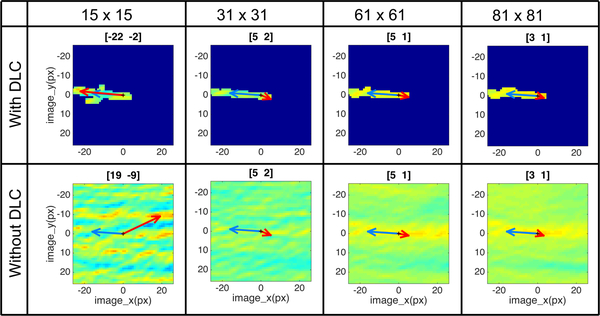
Fig.13.
Normalized Cross-Correlation (NCC) maps for location 7 in Fig.11, with different reference chip sizes and with and without (DLC). Blue arrows are expected displacement derived from the InSAR velocity data, and red arrows are feature tracking results, i.e. the NCC peaks for each case. The relative locations of the NCC peaks are presented on top of each plots in the precision of integer. Dark blue areas in the DLC results mean that NCC was not calculated.

