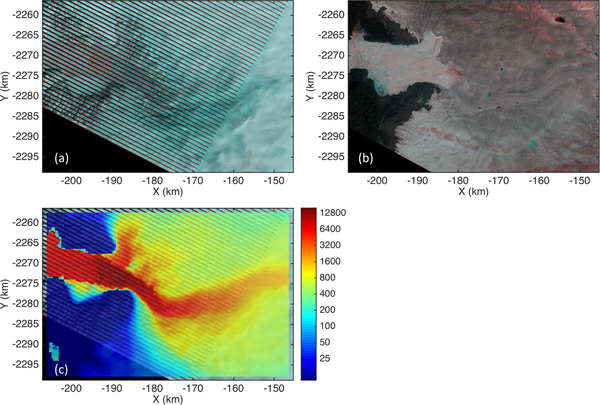
Fig.5.
Anaglyphic color images of the test pairs and reference velocity information, (a): ETM+ image pair of 1 April 2009 and 17 Apr 2009, (b) OLI image pair of 12 July 2014 and 28 July 2014, (c) interpolated InSAR velocity map as a priori data, color-coded in unit of m/yr, with 5(a) in its background. The earlier image in each tested pairs is colored in red, while the latter one is in cyan.

