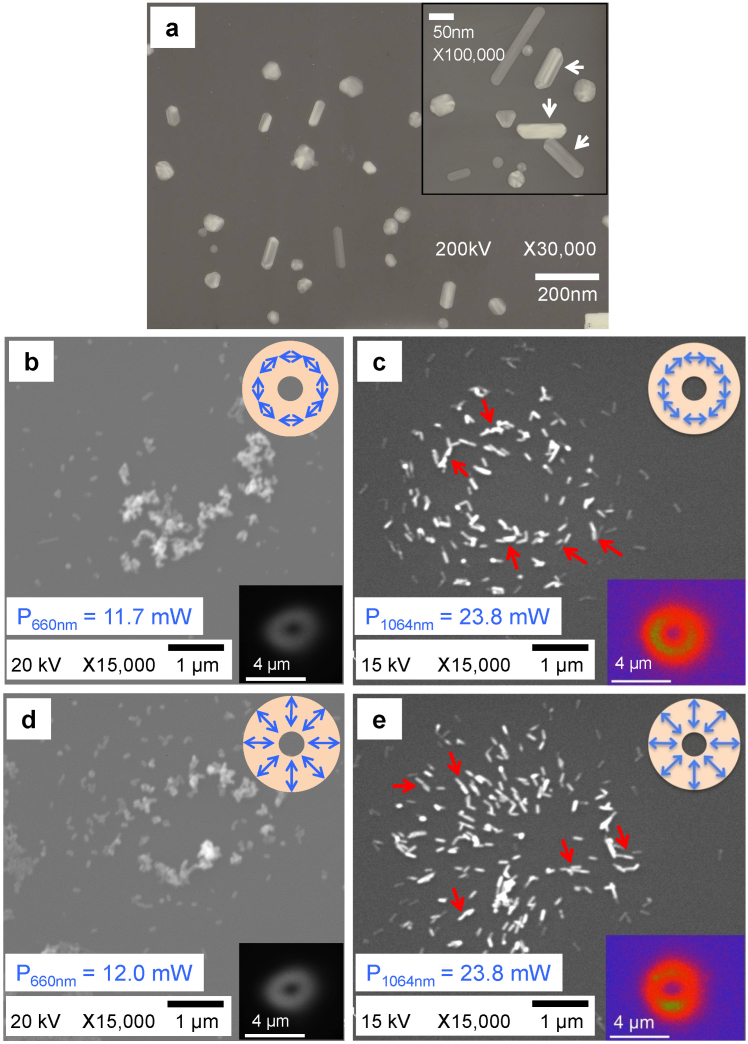
Figure 2. Electron microscope images of the Ag nanorods before and after selection by doughnut laser beams with different wavelengths.
a, Transmission electron microscope (TEM) image of Ag NPs used in this study without laser irradiation. Inset: enlarged view. b, c Scanning electron microscope (SEM) images of Ag NRs selected by the azimuthally polarized doughnut beam. d, e SEM images of Ag NRs selected by the radially polarized doughnut beam. Beams of 660 nm and 1064 nm wavelengths were used for b, d and c, e, respectively. The insets of b, c, d and e show the intensity distribution of the doughnut beam, as visualized by using fluorescence; and a schematic of the respective polarization.

