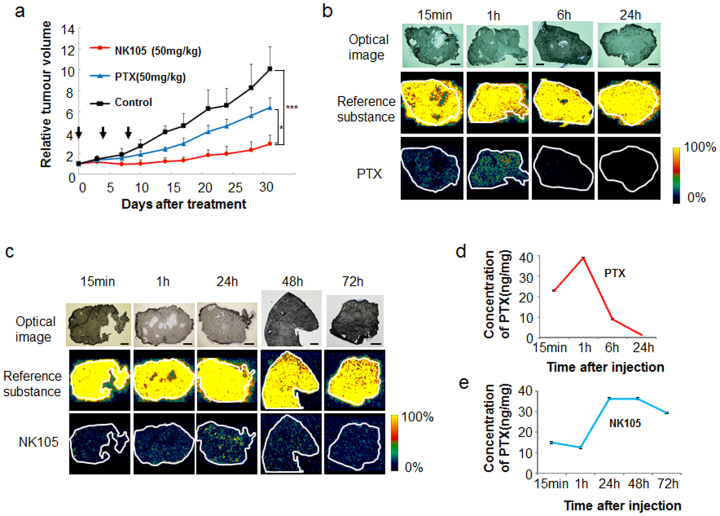
Figure 2. Antitumour activity and visualisation of PTX and NK105 distribution with MS analysis.
(a) Antitumour activity was examined in an animal model with BXPC3 xenografts. NK105, PTX, or saline (as a control) was administered at a PTX equivalent dose of 50 mg/kg on days 0, 4, and 8. *P < 0.05 (PTX vs. NK105), ***P < 0.001 (saline vs. NK105). Bar = SD. (b)(c) Imaging of PTX within the tumour was performed after PTX (b) or NK105 (c) administration at a dose of 100 mg/kg. The upper, middle, and lower columns display the optical images, reference substance (an arbitrary signal of m/z 824.6), and PTX (specific signal of m/z 892.3 [M + K]+), respectively. Bar, 1 mm. (d)(e) LC-MS analysis of the PTX concentration in the tumours treated by PTX (d) or NK105 (e). Tissue sections serial to those shown in (b) and (c).

