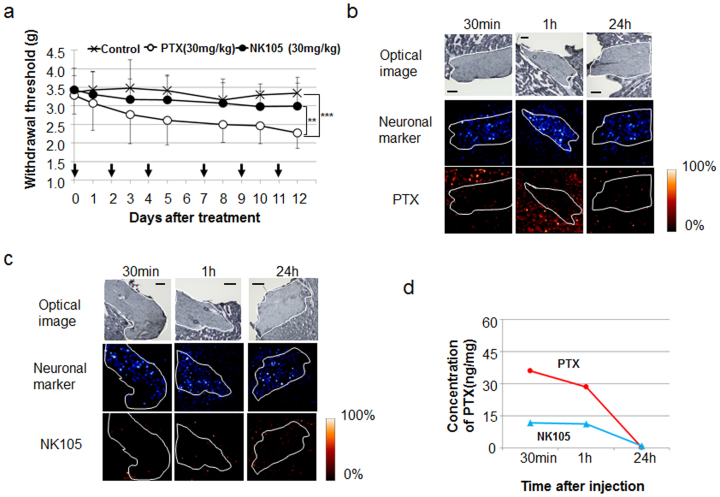
Figure 4. Peripheral neurotoxicity and visualisation of PTX and NK105 distribution by MS analysis.
(a) Mechanical sensory stress was assayed in an animal model of PTX-induced peripheral neuropathy. NK105, PTX, or saline was administered at 30 mg/kg on days 0, 2, 4, 7, 9, and 11. **P < 0.01 (PTX vs. NK105), ***P < 0.001 (saline vs. PTX). Bar = SD. (b) (c) PTX within neuronal tissue was imaged after PTX (b) or NK105 (c) administration at a dose of 50 mg/kg. The upper, middle, and lower columns show the optical images, a neuronal marker (sphingomyelin-specific signal of 851.6 m/z), and PTX (specific signal of m/z 892.3 [M + K]+), respectively. The neuronal area is delineated by a white line. Bar, 200 μm. (d) Analysis of the PTX concentration by LC-MS. Tissue sections serial to those shown in (b) and (c).

