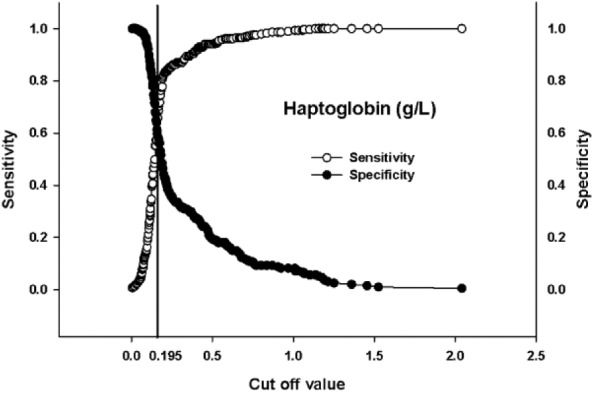
Figure 2.

Sensitivity and specificity curves for haptoglobin concentration based on controls and cases of bovine respiratory disease in pre-weaned dairy calves diagnosed using parallel interpretation of thoracic ultrasound and auscultation. The cutoff value is represented by the vertical line at the intersection of the curves.
