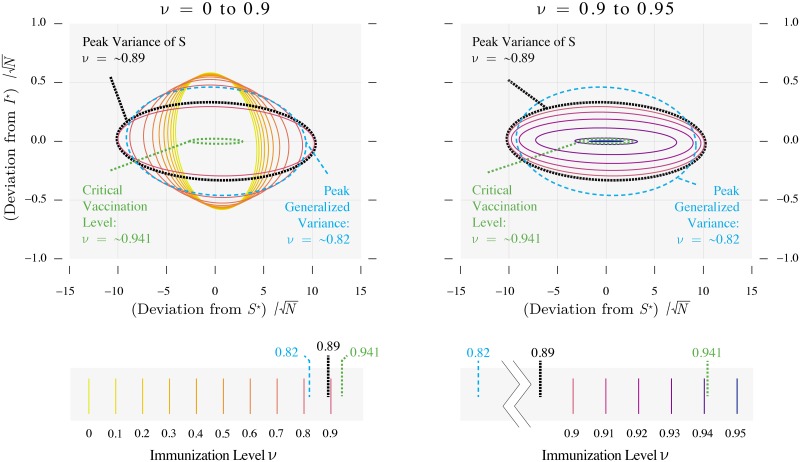
Fig 6. Bivariate spread of the deviations from the equilibrium as a function of vaccine uptake.
The ellipses indicate the area containing the deviations 95% of the time. The area of the ellipse is largest in the vicinity of the threshold immunization level, which is consistent with the common result that critical slowing down leads to increases in variance. Parameters are as in Fig 2.

