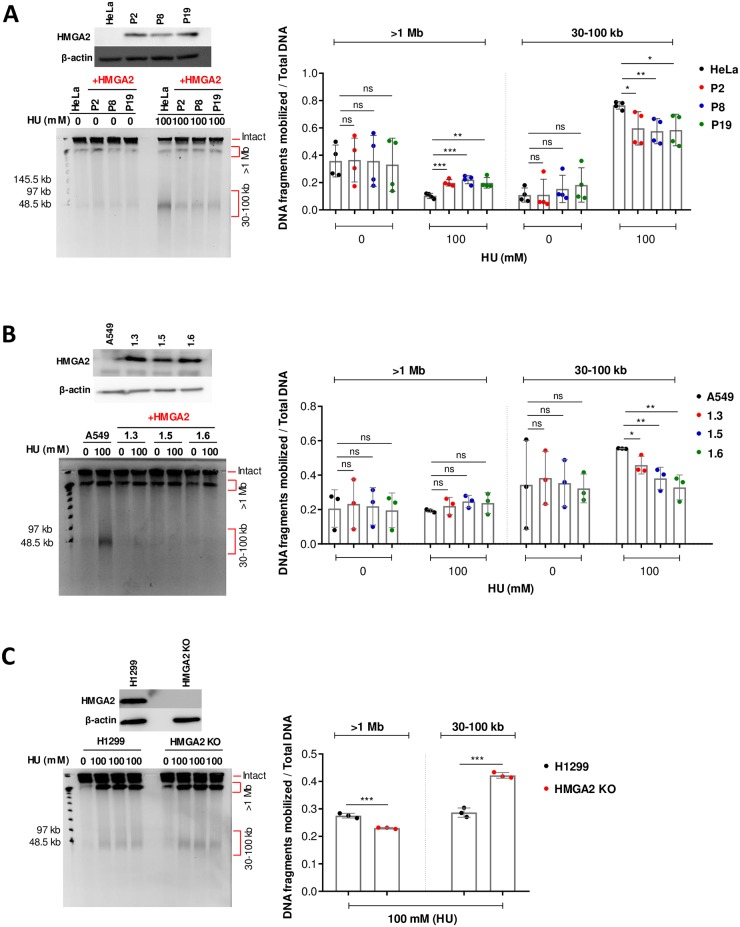
Fig 1. HMGA2 protects against HU-induced DSBs.
(A) A Western blot shows corresponding HMGA2 expression levels in HeLa cells (parental and three recombinant human HMGA2-expressing cell lines) (top left panel). Representative PFGE analysis of DSB formation in HeLa cells in response to 24 h incubation with HU (left panel). Quantification of HU-induced DNA fragments (>1 Mb and 30–100 kb fractions) (right panel) was done by ImageJ software with each fragment fraction normalized to total DNA loaded (n = 4 independent experiments). Error bars show SD. Unpaired two-tailed t-tests. ns not significant, * p < 0.05, ** p < 0.01, *** p < 0.001. (B) A Western blot shows corresponding HMGA2 expression levels in A549 cells (parental and three recombinant human HMGA2-expressing cell lines) (top left panel). Representative PFGE analysis of DSB formation in A549 cells in response to 24 h incubation with HU (left panel). Quantification of HU-induced DNA fragments (>1 Mb and 30–100 kb fractions) (right panel) was done by ImageJ software with each fragment fraction normalized to total DNA loaded (n = 3 independent experiments). Error bars show SD. Unpaired two-tailed t-tests. * p < 0.05, ** p < 0.01. (C) A Western blot shows corresponding HMGA2 expression levels in H1299 cells (parental and HMGA2 KO) (top left panel). Representative PFGE analysis of DSB formation in H1299 cells in response to 24 h incubation with HU (left panel). Quantification of HU-induced DNA fragments (>1 Mb and 30–100 kb fractions) (right panel) was done by ImageJ software with each fragment fraction normalized to total DNA loaded (n = 3 independent experiments). Error bars show SD. Unpaired two-tailed t-tests. *** p < 0.001.

