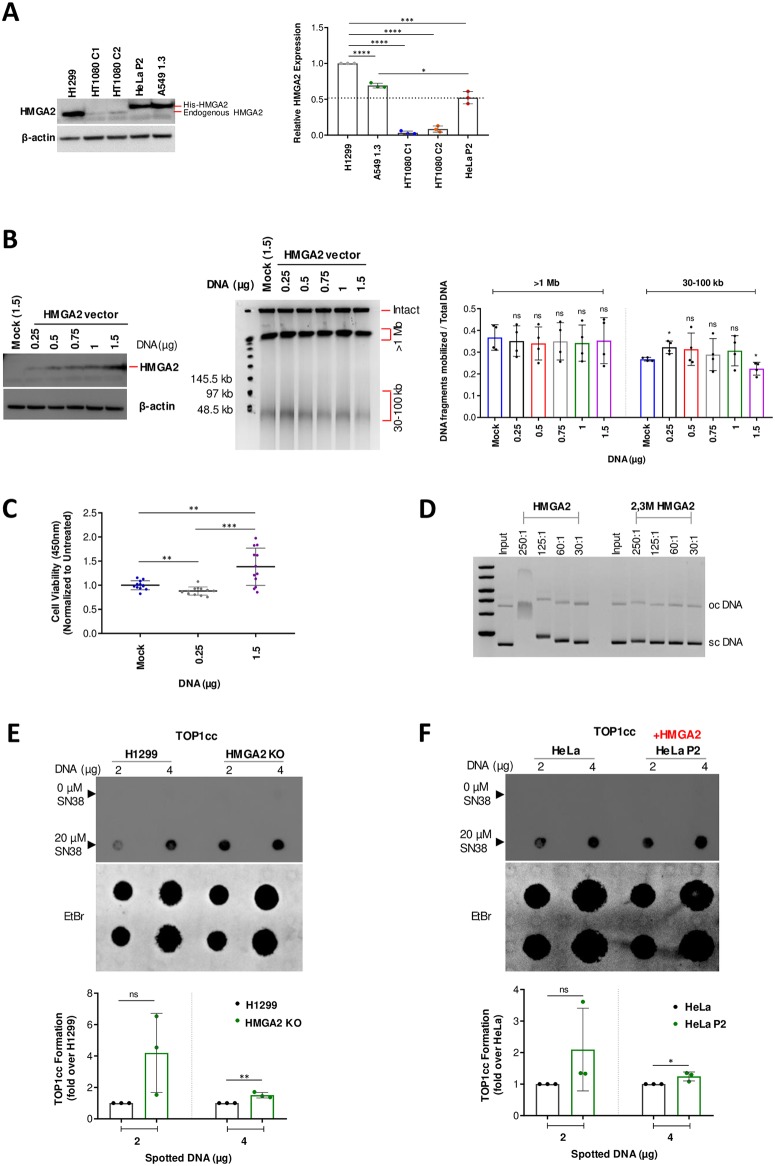
Fig 4. HMGA2 expression levels determine differential chemosensitivity to SN38.
(A) Representative Western blot analysis comparing endogenous (H1299 and HT1080 C1/C2 cells) and His-tagged (HeLa P2 and A549 1.3 cells) exogenous HMGA2 levels across various cell lines (left panel). β-actin was used as a loading control. Quantification (right panel) of HMGA2 expression relative to H1299 (set as 1) using ImageJ software (n = 3 independent experiments). The dotted line indicates an arbitrary functional threshold level for high versus low/moderate HMGA2 expression. Error bars show SD. Unpaired two-tailed t-tests. * p < 0.05, *** p < 0.001, **** p < 0.0001. (B) Western blot of HMGA2 expression (left panel) after transfection with indicated amounts of HMGA2 expression vector in H1299 HMGA2 KO cells (mock vector served as control) using the anti-HMGA2 antibody (Ab41878). Representative PFGE analysis of DSB formation in transfected cells after SN38 treatment (2 μM) for 48 h (centre panel). Quantification of SN38-induced DNA fragments (>1 Mb and 30–100 kb fractions) (right panel) was done by ImageJ software with each fragment fraction normalized to total DNA loaded (n = 4 independent experiments). Error bars show SD. Unpaired two-tailed t-tests. * p < 0.05. (C) Cell survival (CCK8) assay in H1299 HMGA2 KO cells transfected with 0.25 μg (low) and 1.5 μg (high) amounts of HMGA2 expression vector (mock vector served as control) followed by SN38 treatment (2 μM) for 48 h. Data plotted as fold change with mock as 100% (n = 4 independent experiments with 3 technical replicates in each). Error bars show SD. Unpaired two-tailed t-tests. ** p < 0.01, *** p < 0.001. (D) Representative higher-order ternary complex formation of HMGA2 and 2,3M HMGA2 carrying mutated AT-hooks 2 and 3 with supercoiled plasmid DNA at indicated HMGA2:DNA molar ratios. HMGA2-DNA complexes were formed during 30 min incubation and subjected to electrophoresis in 0.8% agarose gels. DNA was stained with ethidium bromide (n = 2 independent experiments). Positions of sc (supercoiled) and oc (open circular/nicked) DNA are indicated. (E) Representative in vivo complex of enzyme (ICE) assay (see Methods), comparing the intracellular formation of TOP1cc between H1299 and HMGA2 KO cells after 20 μM SN38 treatment for 30 min (top panels). The amount of genomic DNA (μg) loaded is indicated and DMSO-treated cells were used as controls. Quantification of SN38 induced TOP1cc formation (bottom panel) with intensities normalized to amounts of spotted DNA that were visualized by staining with Ethidium bromide and plotted as fold change relative to parental H1299 cells (n = 3 independent experiments). Error bars show SD. Unpaired two-tailed t-tests. ** p < 0.01. (F) Representative in vivo complex of enzyme (ICE) assay, comparing the intracellular formation of TOP1cc between HeLa and HeLa P2 cells after 20 μM SN38 treatment for 30 min (top panels). DMSO treated cells were used as controls. Quantification of SN38 induced TOP1cc formation (bottom panel) with intensities normalized to the amounts of spotted DNA that were visualized by staining with Ethidium bromide and plotted as fold change relative to parental HeLa cells (n = 3 independent experiments). Error bars show SD. Unpaired two-tailed t-tests. * p < 0.05.

