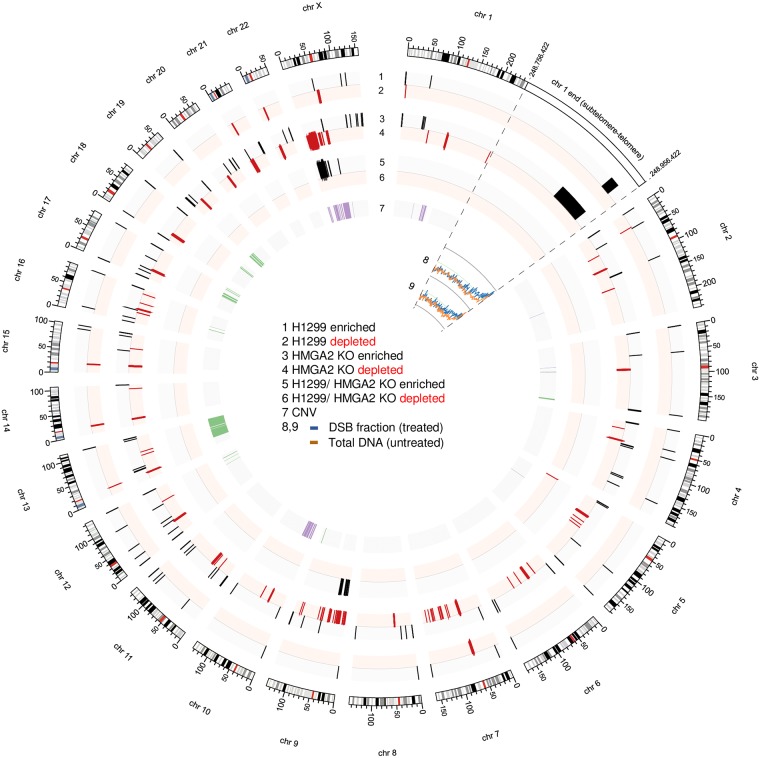
Fig 6. Genome-wide mapping of the SN38-induced double strand break (DSB) fractions in H1299 and HMGA2 KO cells.
The SN38-induced 30–100 kb fragment fraction (DSB fraction) and total genomic DNA were sequenced, and the reads were aligned to the human genome as described in the Materials and Methods section. Regions showing differential enrichment or depletion (false discovery rate (FDR) <1%) in the DSB fraction relative to untreated genomic DNA are illustrated by black and red colour, respectively in plots 1 and 2 (for H1299) and plots 3 and 4 (for HMGA2 KO); while regions with differential enrichment/depletion (FDR < 1%) in parental versus HMGA2 KO cells are shown in plots 5 and 6. Subtelomeric/telomeric regions were similarly enriched in the 30–100 kb fraction of both SN38-treated cell samples. As an example, the last 200 kb of chromosome 1 is enlarged (boxed region), and the normalized coverage values for the DSB fraction (blue lines) and the untreated total genomic DNA (orange lines) are shown for both H1299 (plot 8) and HMGA2 KO (plot 9) cells. Copy number variations (CNV) in untreated HMGA2 KO cells compared to untreated parental H1299 cells are shown on plot 7, with purple indicating copy number gain and green indicating loss. Values for plots 1–7 were calculated using 20 kb bins, while plots 8–9 utilize 500 bp bins. Figure generated using Circos [62].

