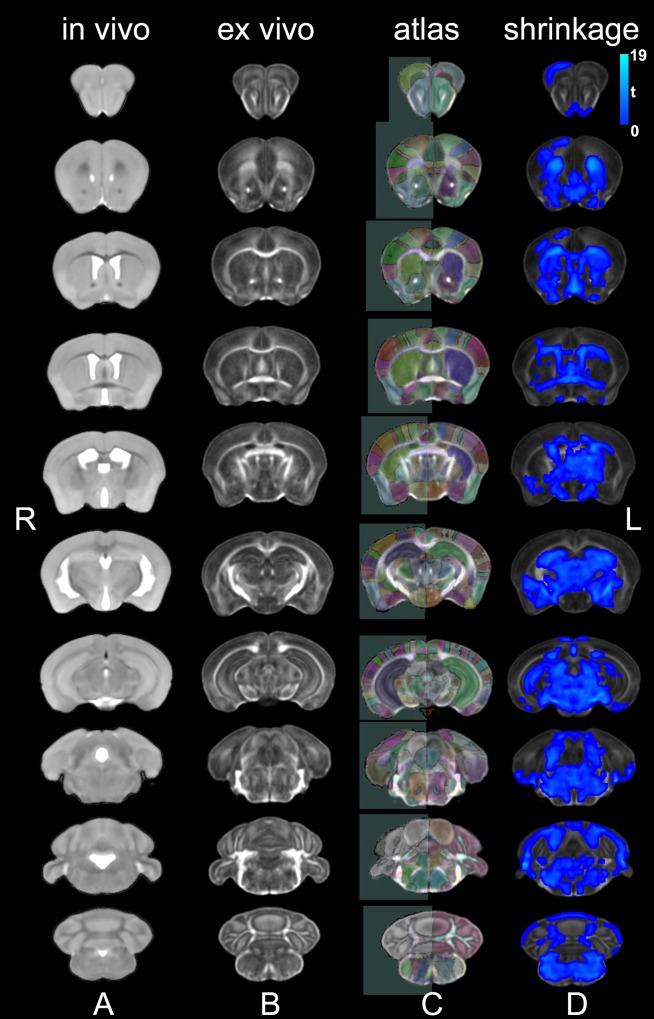
Fig 2. In vivo and ex vivo study specific templates normalized into a 3rd generation Waxholm space.
We created study specific templates for in vivo T2-weighted FSE images (A) and ex vivo DTI parametric images. The transforms used to register the DWI contrasts were re-used to generate the FA template, with good contrast for gray/white matter boundaries (B). We automatically segmented 332 regions for the ex vivo specimens based on a reference atlas [28] (C). A comparison of the in vivo versus ex vivo images revealed areas of shrinkage (blue) in control specimens. The statistical tmaps were cluster-corrected for multiple comparisons, using an FDR threshold of 5%, and an initial cluster forming threshold significance level of 0.05 (D).

