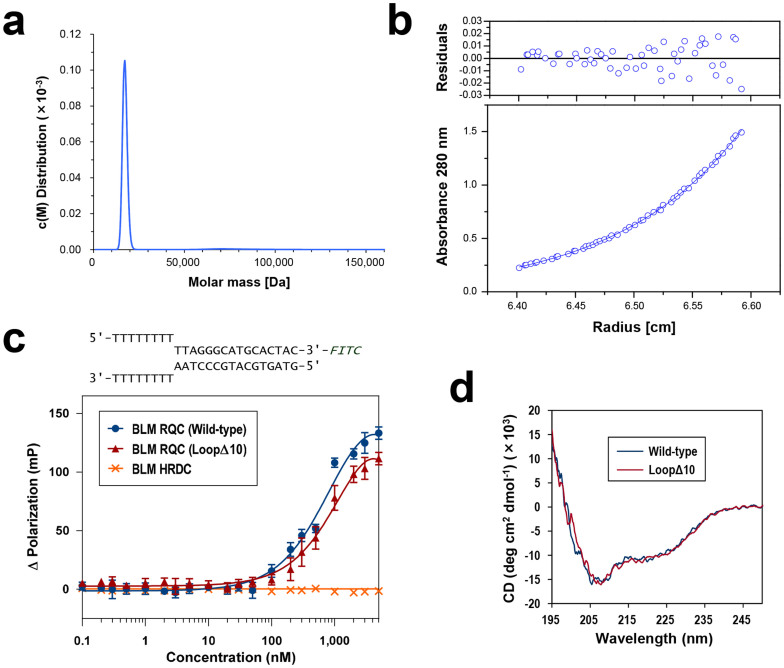
Figure 4. Ultracentrifugation, DNA-binding assay, and CD spectra of BLM RQC.
(a) Ultracentrifuge sedimentation-velocity analysis of BLM RQC. The molar mass distribution curve obtained from the experiment shows a single peak at 17.2 kDa. (b) Ultracentrifuge sedimentation-equilibrium analysis of BLM RQC. Observed absorbance at 67 μM protein concentration is plotted against the radial distance. The best-fit curve from a single-species model is overlaid, yielding a molecular mass of 14.4 kDa. The upper part shows the residuals expressed as the difference between the experimental and the fitted data. Comparable results were obtained for 34 and 200 μM protein concentrations. (c) DNA-binding assay examined by fluorescence polarization. The forked duplex sequence (FITC-labeled) used in the assay is shown at the top. Interactions between the DNA and BLM RQCs in GST-free form (wild-type and loopΔ10 mutant; blue circles and red triangles, respectively) were examined with increasing protein concentrations from 0 to 5 μM. The BLM HRDC domain (a.a. 1200–1295; orange crosses)7 was also purified and used as a negative control in the experiment. (d) CD spectra of BLM RQC wild-type and the loopΔ10 mutant. Both samples yielded almost identical plots.

