
Figure 2. Infarct sizes (±SEM) in all groups.
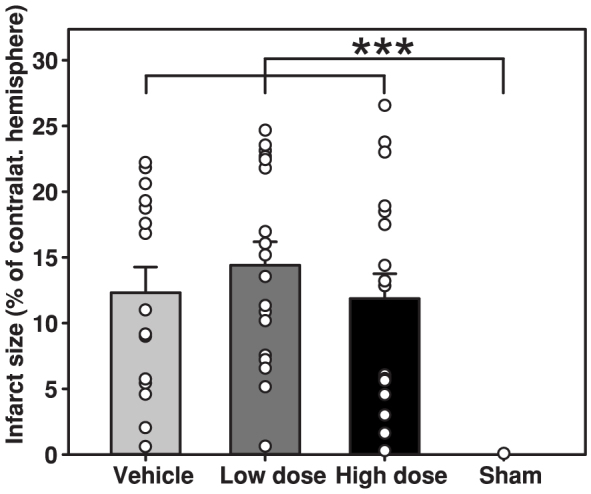
The white dots represent individual infarct sizes. There were no significant differences between the vehicle, low dose and high dose groups.
Official websites use .gov
A
.gov website belongs to an official
government organization in the United States.
Secure .gov websites use HTTPS
A lock (
) or https:// means you've safely
connected to the .gov website. Share sensitive
information only on official, secure websites.
The white dots represent individual infarct sizes. There were no significant differences between the vehicle, low dose and high dose groups.