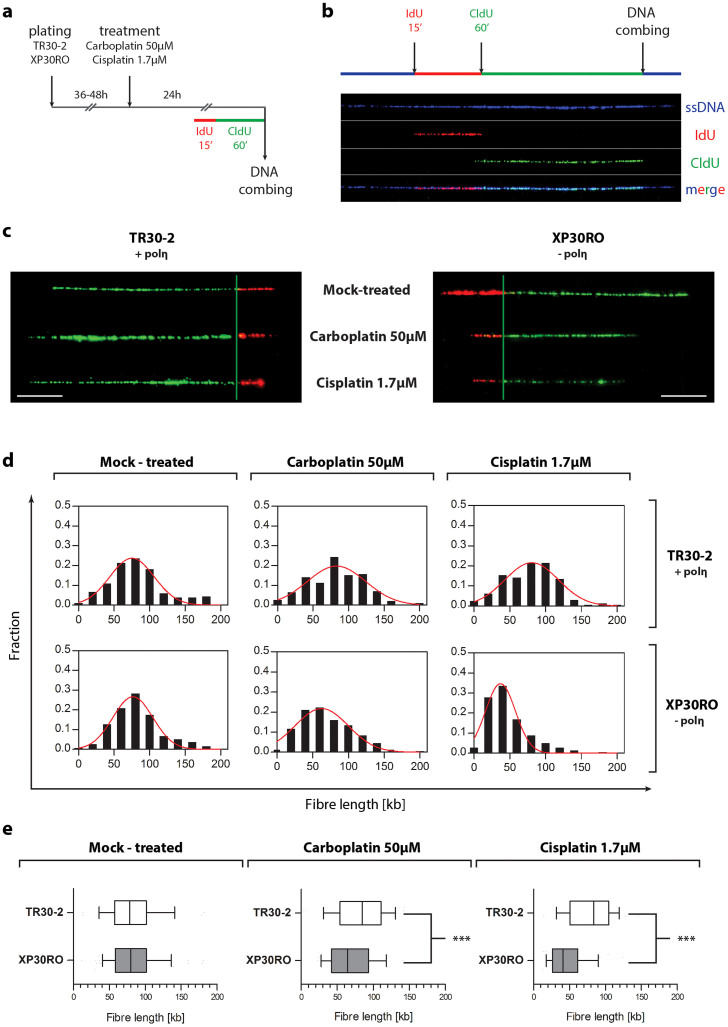
Figure 2. Analysis of DNA replication by DNA combing.
(a) A schematic outline of the DNA combing protocol is shown. (b) DNA fibres were visualized using specific primary antibodies and fluorescently-labelled secondary antibodies. A representative fibre is shown. Single-stranded DNA is shown in blue, IdU-labelled DNA in red, and CldU-labelled DNA in green. (c) Representative, individual DNA fibres for each experimental condition are presented. (d) The frequency distribution of fibres of particular lengths is presented as histograms plots. Data represent the population of fibres obtained by measuring at least 150 individual DNA fibres for selected experimental conditions, in two independent experiments. The red line indicates a Gaussian curve fitted to the data. (e) Data are presented as inbox-and-whiskers graphs. Each box represents the 25th and 75th percentile (the lower and upper quartiles, respectively). The median (50th percentile) is marked as the line near the middle of the box. Data not included between the whiskers are plotted as outliers (dots). Data was analyzed by the use of the Mann-Whitney test. Asterisks indicate statistically significant differences.

