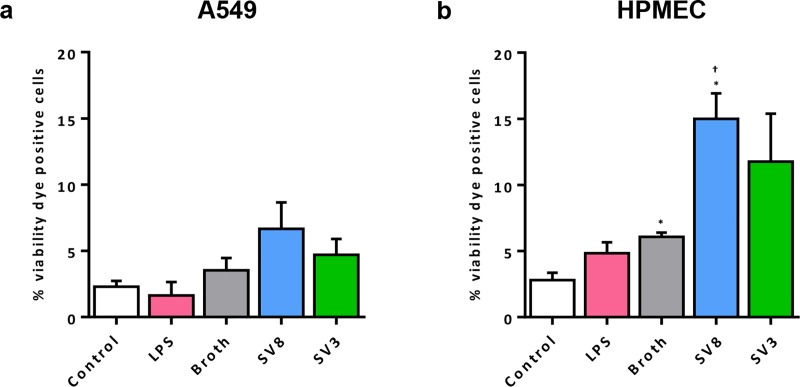
Fig 1. Ureaplasma-driven cell death in pulmonary epithelial and endothelial cells.
Following a 24 h stimulation period, numbers of dead cells were determined for different conditions using flow cytometry and a viability dye staining dead cells. Results for A549 cells are shown in (a), whereas (b) depicts the percentage of dead HPMEC. Data are presented as means ± SD and were obtained from n = 3 individual experiments. Cells stimulated with LPS were compared vs. control, cells exposed to Ureaplasma spp. vs. control and vs. broth. * p < 0.05 compared to untreated controls; † p < 0.05 compared to cells treated with broth. SV8: Ureaplasma urealyticum serovar 8, SV3: Ureaplasma parvum serovar 3.

