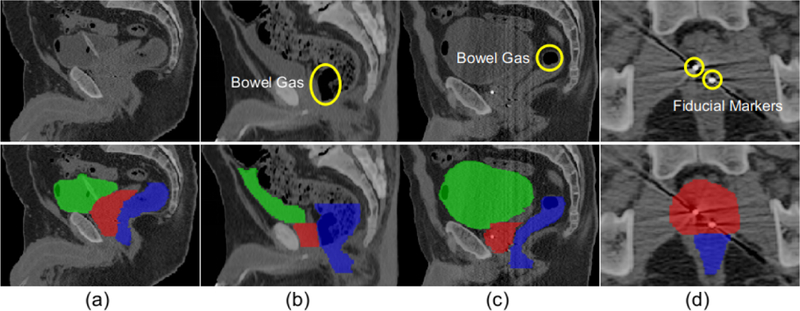
Figure 1.

Typical CT images and their pelvic organ segmentations. The four columns indicate images from four patients. The first row shows the original CT slices and the second row shows the same corresponding slices overlaid with their respective segmentations. Yellow circles in (b) and (c) indicate different amounts of bowel gas in the rectum, while yellow circles in (d) indicate two fiducial markers in the prostate. Red denotes the prostate, green denotes the bladder, and blue denotes the rectum. The first three columns are shown in the sagittal view and the last column is shown in the axial view.
