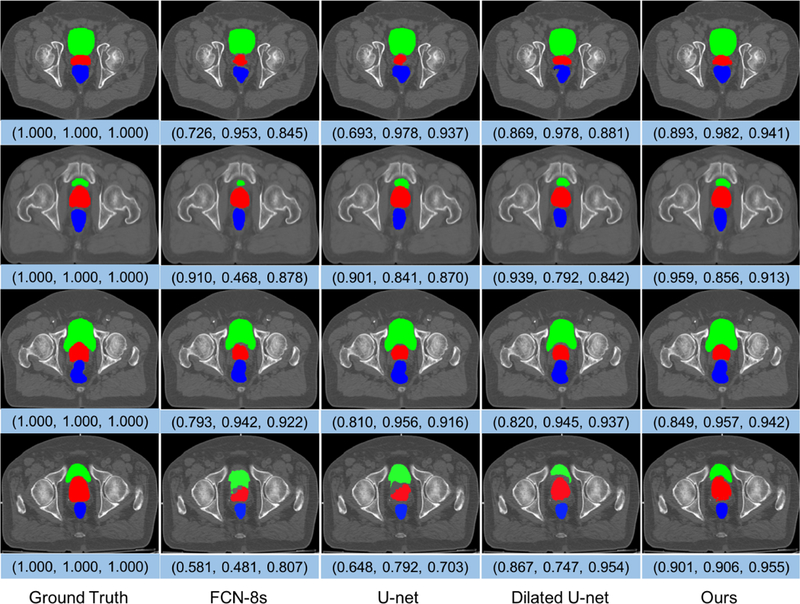
Figure 6.

Representative cases of the segmentation results of the prostate (red), bladder (green), and rectum (blue) obtained by FCN-8s, U-net, Dilated U-net, and our multi-label segmentation network. These images are from different subjects and shown in the axial view. The triple array at the bottom of each image denotes the DSC values of the prostate, bladder, and rectum, respectively.
