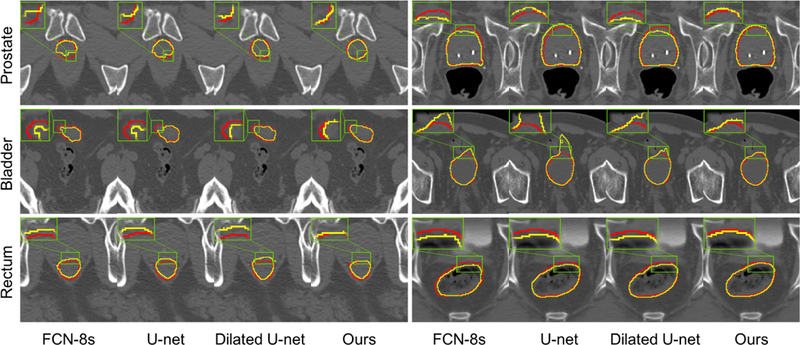
Figure 7.

Comparison between segmentations produced by different networks and the ground truth segmentation. Each row shows two representative cases for each organ. Red curves indicate the manual delineations, and yellow curves indicate the automatic segmentations.
