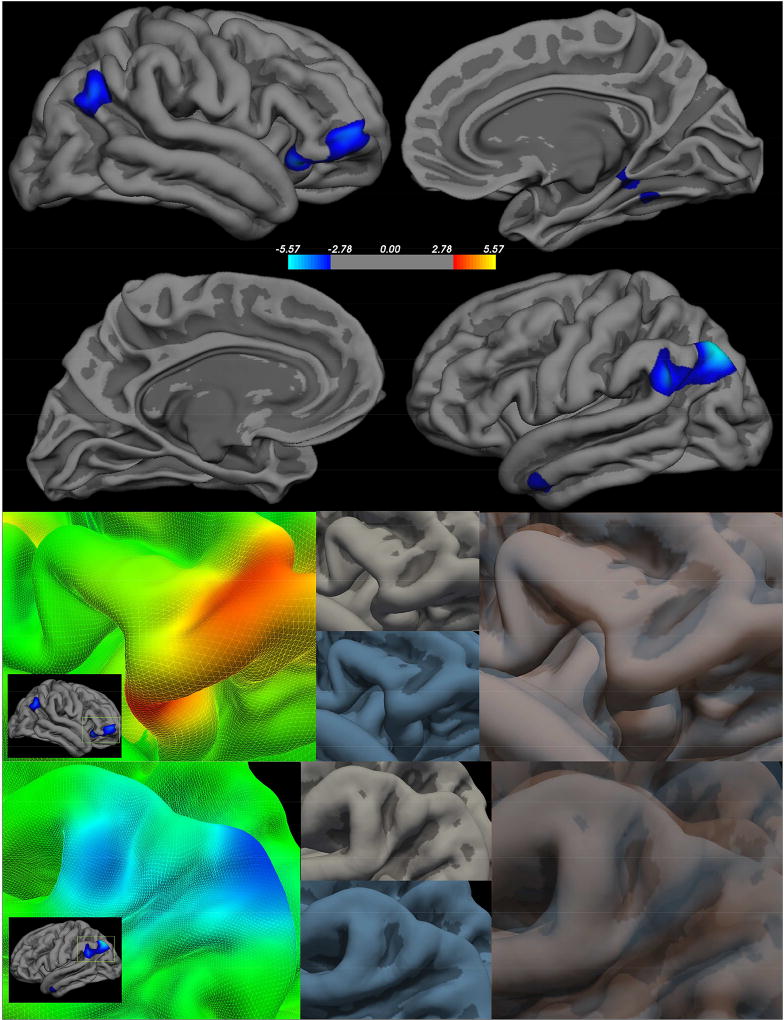
Figure 1. Clinical High Risk > Healthy Controls - local Gyrification Index.
Right Hemisphere (first panel top) Left Hemisphere FDR (first panel bottom) - FDR corrected p<0.05; Peak clusters are highlighted in the second panel (group statistical image left) to demonstrate how each feature varies between the CHR (group average in blue lower center) and HC (group average upper center in gray), which were then overlaid to highlight the surface differences.

