Figure 1:
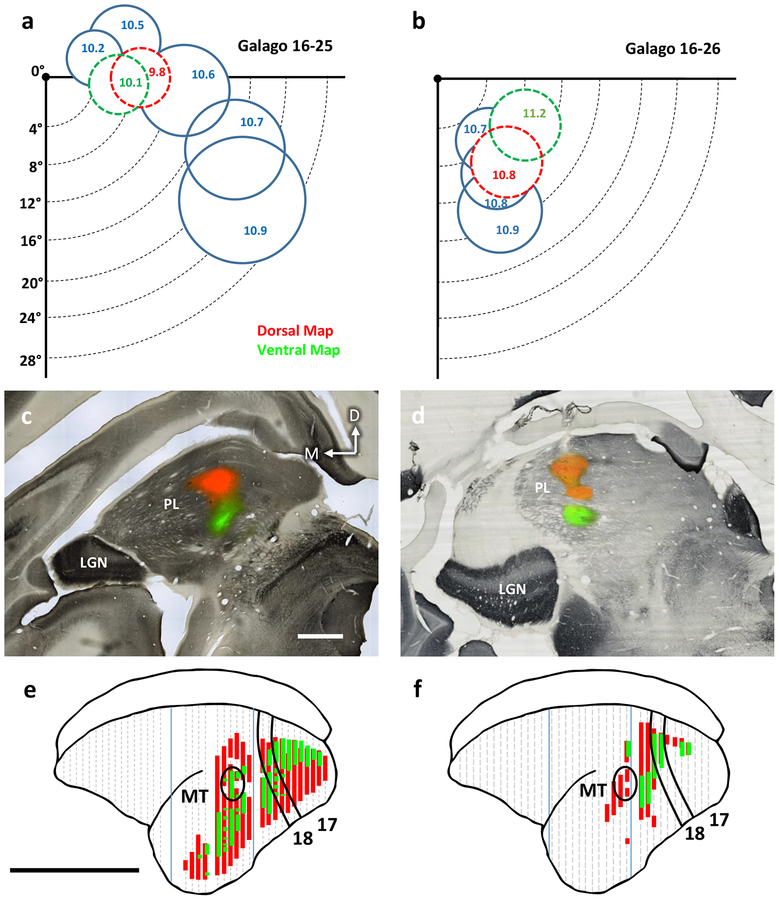
Distributions of labeled neurons in visual cortex after injections of CTB into the retinotopic maps in the lateral and inferior pulvinar in two galagos. a-b) Receptive fields for multiunit recordings in the dorsal and ventral maps in the pulvinar of galagos 16–25 and 16–26. The receptive fields are drawn on a depiction of the contralateral lower visual quadrant with 0° corresponding to area centralis of the retina. Receptive fields drawn in blue correspond to retinotopic mapping done using a tungsten electrode. Those fields drawn in red and green were obtained at the dorsal and ventral map injection sites, respectively. Indicated values are the cortical depths at which the circumscribed receptive fields were recorded. c-d) Coronal sections stained for CO overlaid on adjacent sections stained fluorescently for the injected CTB. Injection sites for the dorsal (red) and ventral (green) maps are shown. Scale bar is 1mm, e-f) The locations of populations of labeled neurons projecting to the dorsal map (red) and ventral map (green) in the coronal plane projected at a 45° angle onto the reconstructed dorsolateral surface of cortex. Borders of areas 17, 18, and MT indicated in black. Blue lines indicate tissue blocking cuts. Dashed grey lines indicate every ninth section of tissue. Scale bar is 1cm.

