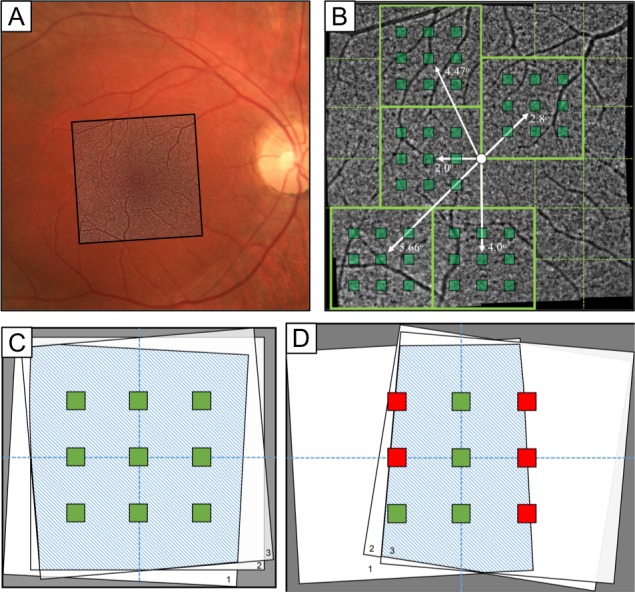
Figure 1.

Image location, registration, and ROI selection. (A) Fundus photo OD with overlaid AO imaging region. (B) Macular AO imaging area with representative imaging locations (green-outlined boxes), the five different foveal eccentricities (white arrows), and ROIs at each imaging location (green-shaded squares). (C) Representation of full overlay across each imaging session capturing all ROIs (green boxes). (D) Representative incomplete overlay between images, causing exclusion of certain ROIs (red boxes).
