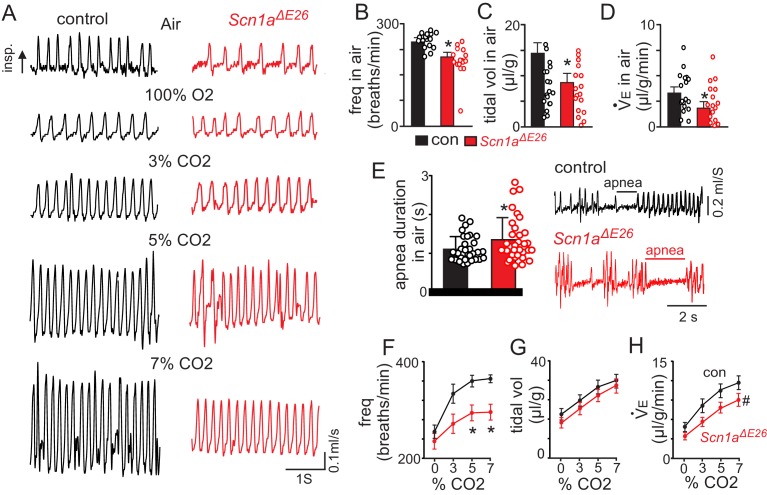
Figure 3. Scn1aΔE26 mice show reduced respiratory output under control conditions and during exposure to high CO2.
For these experiments Scn1afl/+ and Slc32a1cre/+ were used as control. (A) traces of respiratory activity from a control and Scn1aΔE26 mouse during exposure to room air, 100% O2 and 3–7% CO2 (balance O2). (B–D), summary data (n = 22 control; n = 17 Scn1aΔE26) show respiratory frequency (B), tidal volume (C) and minute ventilation (D) are reduced in Scn1aΔE26 mice compared to control under room air conditions. (E), traces of respiratory activity (left) and summary data (right) show that under room air conditions both control and Scn1aΔE26 mice exhibit periods of apnea; the frequency of these events were similar between genotypes, however, they lasted for a longer duration in Scn1aΔE26 mice compared to control. F-H (Figure 3—source data 1), summary data shows the respiratory frequency (F), tidal volume (G) and minute ventilation response of control and Scn1aΔE26 mice to graded increases in CO2 (balance O2). Scn1aΔE26 mice showed a blunted respiratory frequency to 5% and 7% CO2 which resulted in a diminished CO2/H+-dependent increase in minute ventilation. These results were compared using either unpaired t test (panels B-E) or two-way ANOVA followed by the Holm-Sidak multiple comparison test (panels F-H). *, difference between means p<0.05, #, different interaction factor, p<0.05.

