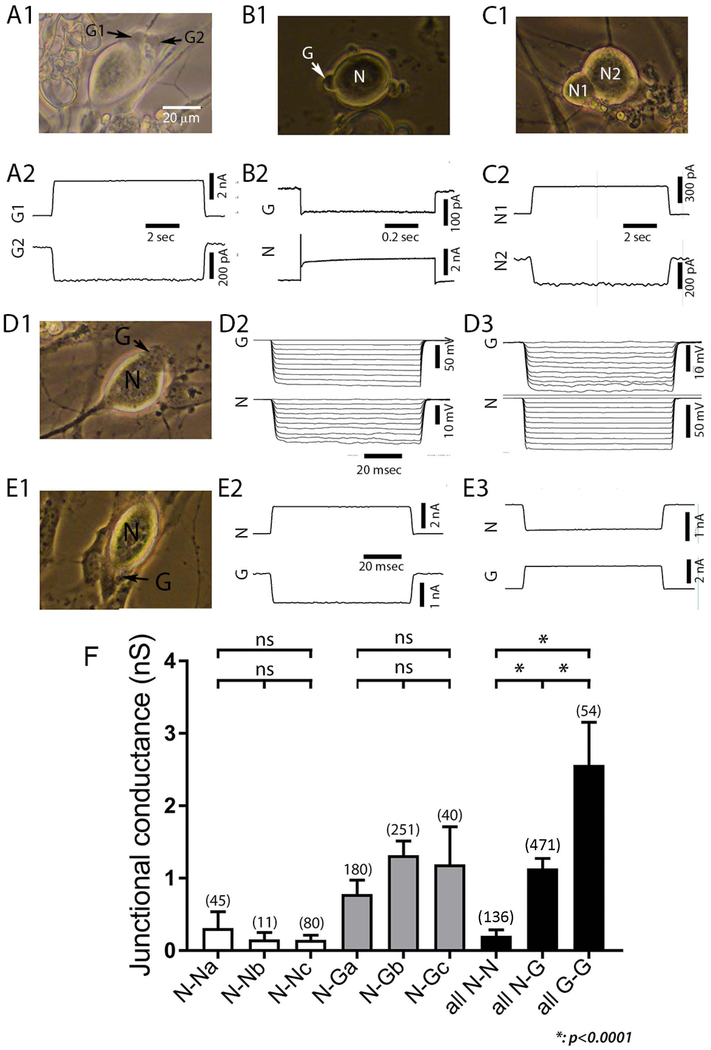
Figure 2. Neurons and SGCs are coupled to themselves and each other in dissociated cultures from trigeminal ganglion.
A-C: Strength of gap junction mediated coupling between representative pairs of satellite glial cells (SGCs, labeled as G1, G2: A1, A2), SGC-neuron pairs (N and G in B1, B2, D1–3, E1–3) and pairs of sensory neurons (N1 and N2 in C1, C2). Accompanying photographs were taken immediately prior to the electrophysiological recordings. Recordings were selected from series of depolarizing or hyperpolarizing steps applied to each cell of the pair. In A2, +40 mV step was applied to G1, current recorded in G2 (IG2) is termed junctional current, and represents the current passed by the voltage clamp circuit on that cell to hold its voltage constant; junctional conductance is calculated as –IG2/V, in this case about 2.5 nS. In B2, +40 mV step was applied to N, in C2, +40 mV step was applied to N2. D2–3 illustrate current clamp recording of bidirectional coupling between SGC and neuron; in D2 10 nA hyperpolarizing steps are applied to G; whereas the same stimulation paradigm is applied to the neuron in D3. E2–3 illustrate bidirectional coupling under voltage clamp conditions, with the neuron depolarized in E2 and the SGC depolarized in E3. F. Summary of results obtained for cell pairs of each type. NN, N-G and GG designate neuron-neuron, N-G and G-G cell pairs respectively. Subgroups a and b represent recordings made of cultures 2–3 days old during two time periods. Group c represent cells pairs recorded within 18 hr after dissociation. There were no significant differences in coupling strength between recording epochs or with regard to whether cells were freshly isolated or maintained in culture and thus groups were combined to compare coupling strength between homocellular and heterocellular pairs (all N-N, all N-G, all G-G), each of which differed significantly from the other groups (p<0.0001).

