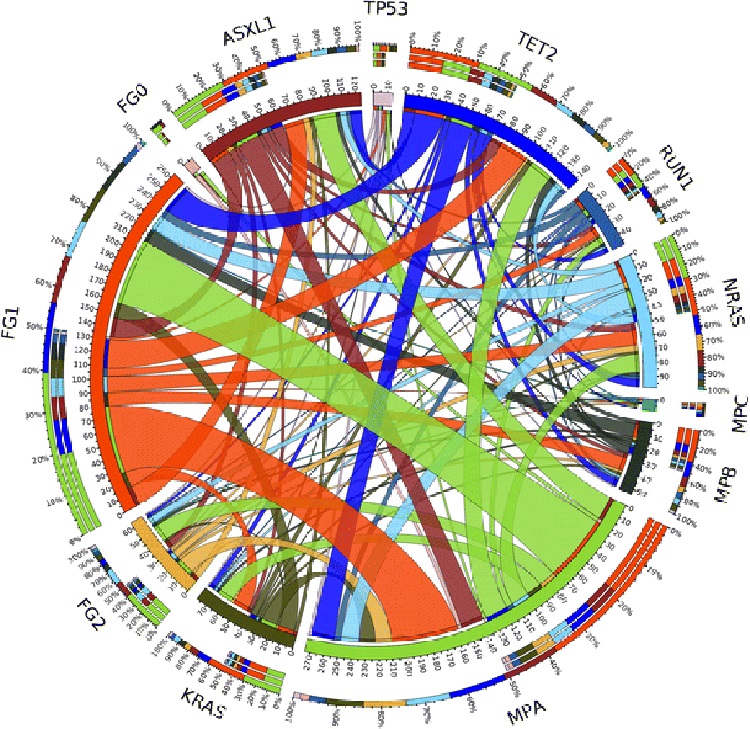
Figure 1. Associations between co-occurring mutations. The thickness of each connecting line represents the frequency with which the two mutations co-occurred.

Abbreviations: FG0=grade 0 bone marrow fibrosis; FG1,grade 1 bone marrow fibrosis; FG2=grade 2 bone marrow fibrosis; MPA=0–20% bone marrow monocytes; MPB=21–40% bone marrow monocytes; MPC=41–60% bone marrow monocytes.
