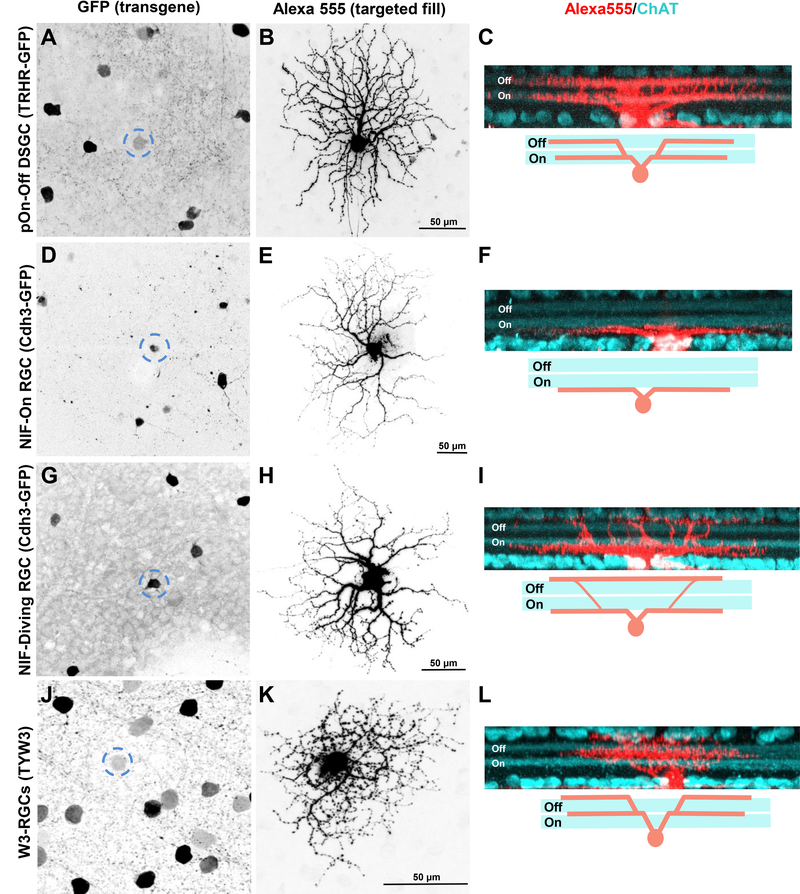
Figure 2.
Specific RGC subtypes are labelled in different transgenic mouse lines. (A-O), Maximum intensity projection images showing GFP+ (A,D,G) and YFP+ (J) somas that were targeted with Alexa Fluor 555 to reveal their complete en face morphologies (B,E,H,K) and dendritic stratification depth patterns (C,F,I,L; red, cell fill; cyan, ChAT immunostaining) in 3 transgenic mouse lines: TRHR-GFP (A-C: pOn-Off DSGC), Cdh3-GFP (D-F: NIH-On RGC; G-I: NIH-diving RGC) and TYW3 (J-L: W3-RGC). Dashed circles in (A,D,G,J) delineate fluorescently labeled somas that were targeted and filled. Scale, 50 μm. Schematics underneath (C,F,I,L) represent the distinct dendritic stratification patterns of each RGC subtype.

