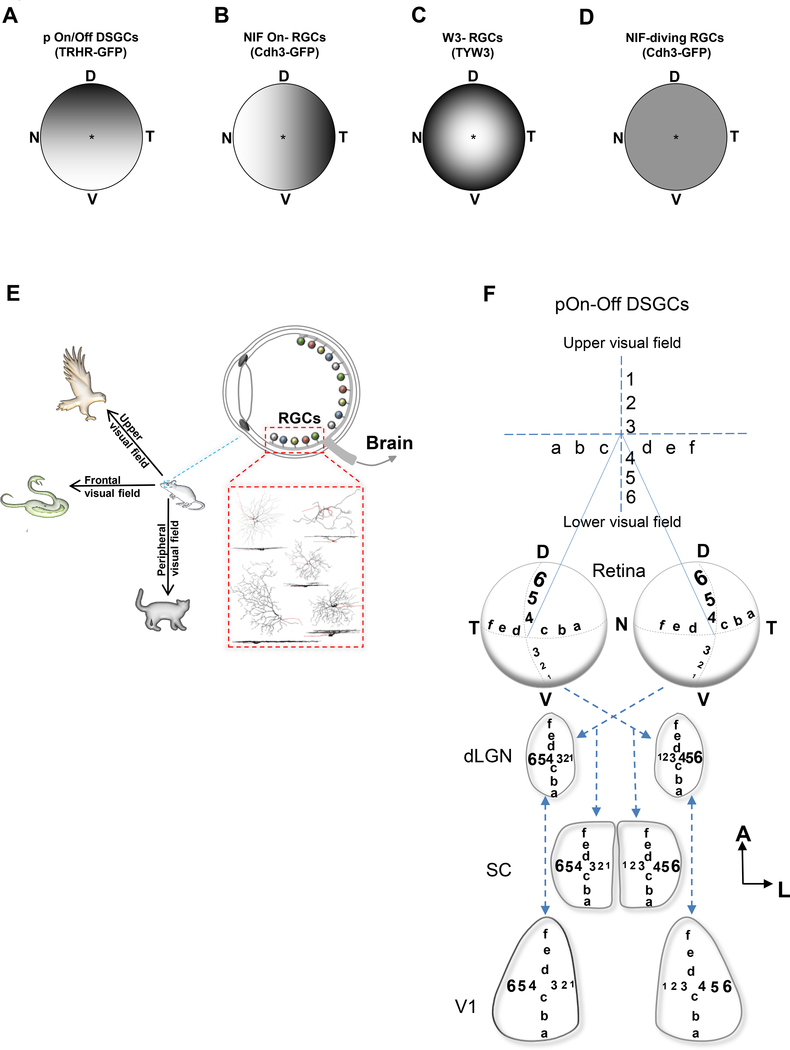
Figure 6.
Mouse retina contains sub-topographical maps for visual signal processing. (A-D) Summary diagrams showing the distributions of dendritic field sizes as a function of retinal location for pOn/Off DSGCs (A), NIF On-RGCs (B), W3-RGCs (C), NIF diving-RGCs (D). (D) dorsal; N, nasal; T, temporal; V, ventral. E, Illustration showing how the distribution of these different RGCs might play a role in their function, and how they are important in dictating survival behaviors in mice.

