
Fig. 1. Ex vivo CNS drug discovery pipeline.
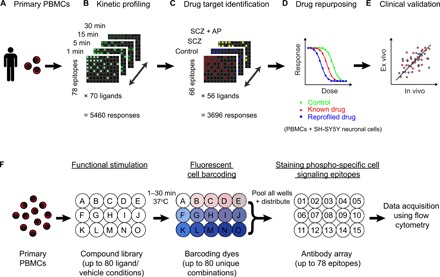
(A) Human primary PBMCs provide an accessible ex vivo model of physiological single-cell phenotypes in health and disease. (B) Time-course exploration of responses to 70 ligands (including CNS ligands and neuropsychiatric treatments) across 78 diverse cell signaling epitopes (5460 responses in total) in T cells from healthy control donors (n = 8) at 1, 5, 15, and 30 min ligand incubation times. (C) Identification of functional drug targets by comparing the T cell signaling response profiles of 56 ligands across 66 cell signaling epitopes (3696 responses) in PBMC samples from three clinical groups: healthy controls (n = 12), antipsychotic drug-naïve patients with SCZ (SCZ; n = 12), and the same patients following 6 weeks of clinical treatment with the atypical antipsychotic olanzapine (SCZ + AP; n = 10). (D) Modeling of disease-associated cellular responses and screening of U.S. Food and Drug Administration (FDA)–approved drugs (repurposing) and experimental neuropsychiatric compounds (n = 946 in total) in T cells from healthy control PBMC donors (n = 6 to 12) and human SH-SY5Y neuronal cells. (E) Validation of the ex vivo cellular model relative to in vivo clinical efficacy in an independent cohort of drug-naïve patients with SCZ (n = 30) treated with two of the study compounds. (F) Experimental design: PBMCs from each donor were distributed across a ligand library (A to O) and stimulated for 1 to 30 min at 37°C. Each ligand or vehicle well was stained with a unique combination of fluorescent barcoding dyes. Ligand wells were pooled and distributed across an array of antibodies (01 to 15) targeting specific phosphorylation or total protein sites on different intracellular signaling proteins. Changes in the activation status of the cell signaling proteins were analyzed at the single-cell level using flow cytometry for each donor individually. Assay plate dimensions are restricted to 15 wells for representation; full dimensions are detailed in brackets.