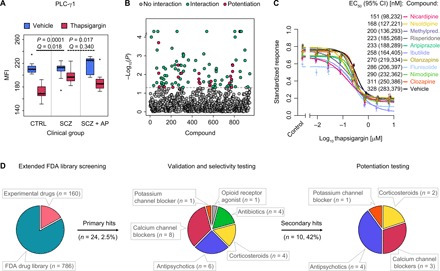
Fig. 5. Phenotypic drug repurposing based on cellular response.

(A) Identification of functional cellular drug target. The attenuated response to thapsigargin at PLC-γ1 in T cells from drug-naïve patients with SCZ (permuted P = 0.0001, Q = 0.018, two-way ANCOVA), relative to healthy controls (CTRL), was reversed after 6 weeks of clinical treatment with the atypical antipsychotic drug olanzapine in vivo (permuted P = 0.017, Q = 0.340; n = 12 healthy controls, n = 12 drug-naïve patients with SCZ, and n = 10 patients with SCZ after antipsychotic treatment). Box plots show interquartile range with the median (horizontal line) and the minimum and maximum values (whiskers), excluding outliers (dots). (B) Results of primary drug screen. Permuted P values from thapsigargin drug interaction testing (two-way ANOVA; n = 6 to 12 healthy PBMC donors) are shown across the combined FDA-approved (n = 786) and experimental (n = 160) compound libraries. Dashed line represents threshold P value of 0.05. Significant hits are shown in green (n = 102), and compounds, which additionally showed selective potentiation of the thapsigargin/PLC-γ1 response (post hoc one-way ANOVA tests; fig. S18), are shown in magenta (n = 22; table S9). (C) Ranking of best selective potentiation candidates at 10 μM concentration in terms of half maximal effective concentration (EC50) shifts in the thapsigargin/PLC-γ1 dose-response curve. Shown are mean values from six healthy PBMC donors (points) with SEM (vertical bars) and fitted four-parameter logistic curves. The y axis represents the MFI standardized as a proportion of minimum and maximum values. Legend shows the EC50 values with 95% confidence intervals (CI). Methylpred., methylprednisolone. (D) Distribution of drug classes across repurposing stages. Extended FDA-approved library screening (left) refers to the primary compound screen at a single dose (20 μM unless otherwise specified in table S8) of compound (n = 946; B). Validation and selectivity testing (center) refer to dose-response titration (24 nM to 200 μM) and validation of selective potentiation candidates and structural class relatives (n = 24; fig. S20; n = 6 healthy PBMC donors). Potentiation testing (right) refers to the titration of thapsigargin (12.5 pM to 20 μM) in the presence of 10 μM concentration of validated compounds (n = 10; C). In vivo effect of olanzapine (A) was reproduced in vitro throughout.
