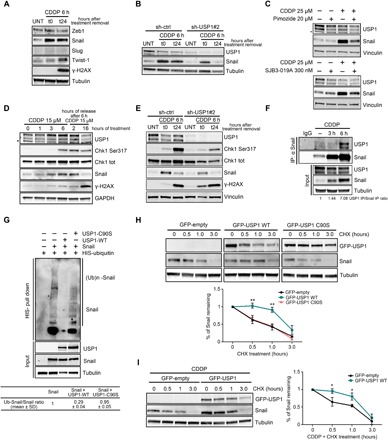
Fig. 2. Snail is a USP1 target protein.

(A) Western blot analysis of the indicated transcription factors and the DNA damage marker γH2AX in COV-362 cells treated with CDDP for 6 hours (t0) and then allowed to repair for 24 hours (t24), as indicated. (B) Western blot analysis of Snail and USP1 expression in COV-362 cells silenced for USP1 and then treated or not with CDDP for 6 hours (t0) and allowed to repair for 24 hours (t24). (C) Western blot analysis of Snail and USP1 expression in COV-362 cells treated with pimozide (top) or SJB3-019A (bottom) in the presence or in the absence of CDDP for 6 hours. Lysates were harvested 24 hours after treatment. (D) Time-course analysis of USP1 and Snail protein expression in MDAH-2774 cells treated with CDDP as indicated. Phosphorylated Chk1 (S317) and γH2AX were used as a marker of DDR. (E) Western blot analysis of Snail, USP1, phosphorylated Chk1 (S317), and γH2AX expression in OVCAR-8 cells stably silenced for USP1 and treated with CDDP for 6 hours (t0) and allowed to repair for 24 hours (t24). (F) Co-IP analyses of endogenous USP1 and Snail proteins in OVCAR-8 cells treated or not with CDDP for 3 and 6 hours. Densitometric analysis of normalized USP1 IP/Snail IP expression is reported. (G) Ubiquitination assay of MYC-Snail in 293T/17 cells cotransfected with His-tagged ubiquitin, MYC-Snail, USP1WT, or USP1C90S and treated with MG132 for 6 hours. Densitometric analysis of Ub-Snail/Snail ratio of three independent experiments is reported in the table. In (E) and (F), input indicates the expression of Snail and USP1 in corresponding cell lysates. Immunoglobulin G (IgG) represents the control IP using an unrelated antibody. (H and I) Western blot analysis of USP1 and Snail expression in OVCAR-8 stably transfected with the indicated plasmids and exposed to a time-course treatment with CHX (H) or treated with CDDP and then with CHX for the indicated times (I). The densitometric analysis of Snail expression (normalized with respect to tubulin expression) is reported in the bottom graphs and represents the mean (±SD) of three independent experiments. Statistical significance was determined by a two-tailed, unpaired Student’s t test (*P < 0.05, **P < 0.01). In the figure panels, an asterisk indicates nonspecific bands, and glyceraldehyde-3-phosphate dehydrogenase (GAPDH), tubulin, or vinculin was used as a loading control.
