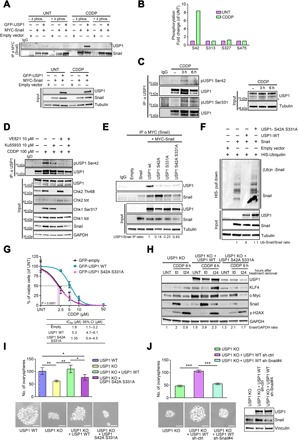
Fig. 4. ATR/ATM-mediated USP1 phosphorylation is required for USP1/Snail interaction.

(A) Co-immunoprecipitation (Co-IP) analyses of MYC-Snail and GFP-USP1 in cells treated or not with CDDP. Cell lysates were collected and treated with or without λ phosphatase before the IP, as indicated. (B) Graph reporting the fold changes of the phosphorylation of the indicated USP1 serines, as evaluated by mass spectometry in MDAH-2774 cells untreated or treated with CDDP for 3 hours, as indicated. (C) Western blot analysis of phosphorylated USP1 (S42 and S331) in MDAH-2774 cells treated or not with CDDP for 3 or 6 hours. Cell lysates were immunoprecipitated with an anti-USP1 antibody and probed with anti-pS42, anti-pS331USP1, or total USP1 protein (right). (D) Western blot of pS42-USP1 expression in MDAH-2774 cells treated or not with CDDP for 3 hours in the presence of Ku55933 (ATM inhibitor), VE-821 (ATR inhibitor), or both, as indicated. Cell lysates were immunoprecipitated with an anti-USP1 antibody and probed with anti-pSer42 or total USP1 protein (top). The correspondent cell lysates (Input) were tested for the expression of USP1 and Snail, and the expression and phosphorylation of CHK1 and CHK2 were used as readouts of ATM and ATR activation and inhibition. (E) Co-IP analyses of USP1 and Snail in cells transfected with MYC-Snail and GFP-tagged USP1WT and USP1 point mutants, as indicated (top). Densitometric analysis of normalized USP1 IP/Snail IP expression is reported. (F) Ubiquitination assay of MYC-Snail in 293T/17 cells cotransfected with His-tagged ubiquitin, MYC-Snail, USP1WT, or USP1S42A/S331A and treated with MG132 for 6 hours. Polyubiquitinated Snail protein was visualized by blotting with an anti-Snail–specific antibody. Densitometric analysis of the Ub-Snail/Snail ratio is reported. (G) Nonlinear regression analyses of cell viability assay in OVCAR-8 cells transfected as indicated and treated with increasing doses of CDDP for 16 hours. Data are expressed as percentage of viable cells with respect to the untreated cells and represent the mean (±SD) of three biological replicates. The table shows the IC50 and the CI of each condition. Fisher’s exact test was used to calculate the global P value reported in the graph. (H) Western blot evaluating the expression of USP1, KLF4, c-Myc, Snail, and γH2AX in OVCAR-8 USP1 KO cells and in USP1 KO cells re-overexpressing USP1WT or USP1S42A/S331A proteins treated or not with CDDP for 6 hours (t0) and allowed to repair for 24 hours (t24). Densitometric analysis of Snail expression (normalized to GAPDH) is reported under the blot and represents the mean of three independent experiments. (I) Graph (top) and representative phase-contrast images (bottom) showing the ovarysphere-forming ability (mean ± SD of three experiments) of the indicated OVCAR-8 cells. Scale bars, 50 μm. (J) Graph (top) and representative phase-contrast images (bottom) indicating the ovarysphere-forming ability (mean ± SD of three experiments) of OVCAR-8 USP1 KO, USP1 KO cells re-overexpressing USP1WT, and USP1 KO cells re-overexpressing USP1WT and silenced for Snail expression using a specific shRNA (shSnail #4). On the right, the Western blot analysis shows USP1 and Snail expression in the used cells. In (A), (C), (D), (E), (F), (H), and (J), tubulin and GAPDH were used as loading control. In the figure, an asterisk indicates a nonspecific band; Input shows the expression of the indicated proteins or phospho-proteins in the lysates used for IP experiments; IgG represents the control IP using an unrelated antibody. In the figure, data represent the mean (±SD) of three independent experiments, and statistical significance was determined by a two-tailed, unpaired Student’s t test. Error bars denote SD (*P < 0.05, **P < 0.01, ***P < 0.001).
