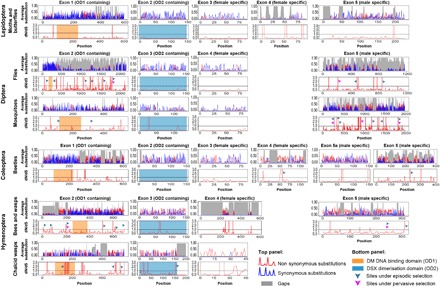
Fig. 3. Exon-level molecular evolution and functional partitioning of dsx across insect orders.

Rates of molecular evolution (average substitutions; top panels) and signatures of selection with reference to nonsynonymous and synonymous substitutions (dN/dS ratios; bottom panels) per codon for each dsx exon are shown separately for each insect group. The exons are arranged according to sequence homology, and the two domain regions are highlighted. Arrows point toward sites under episodic (green arrows) and/or pervasive (magenta arrows) positive selection.
