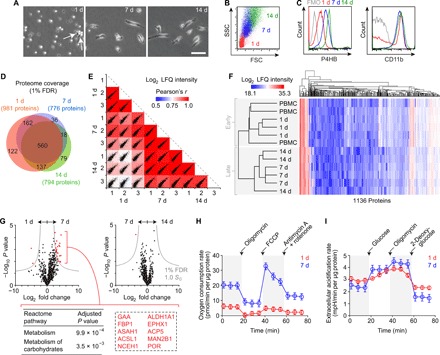
Fig. 2. Characterization of human FC differentiation in vitro.

(A) Phase-contrast images showing cell morphology after 1, 7, and 14 days in monolayer culture. White arrows indicate early somatic protrusions. Scale bar, 50 μm. (B) FSC and SSC features on flow cytometry at 1, 7, and 14 days. (C) P4HB and CD11b expression at 1, 7, and 14 days. Fluorescence minus one (FMO) controls are shown in gray. (D) Venn diagram summarizing proteome coverage at 1, 7, and 14 days (n = 3 per condition). (E) Scatterplot matrix summarizing correlation analysis of log2 LFQ intensities (relative protein abundances) at 1, 7, and 14 days (n = 3 per condition). Correlation coefficients corresponding to each scatterplot (calculated using Pearson’s r) are represented by the heatmap overlay. (F) Hierarchical clustering analysis of log2 LFQ intensities in PBMCs and differentiating FCs at 1, 7, and 14 days (n = 3 per condition). (G) Volcano plots summarizing differential protein abundance at 1 day versus 7 days and 7 days versus 14 days (n = 3 per condition). Gray curves denote cutoff criteria, generated in Perseus; P values were calculated using Student’s t test. The table lists Reactome pathway terms significantly enriched in the protein set overrepresented at 7 days compared to 1 day; the dashed rectangle highlights the specific proteins associated with enrichment of both terms. The term list was generated using Enrichr; P values were calculated using Fisher’s exact test with Benjamini-Hochberg adjustment. Additional enrichment data are presented in table S1. (H) Real-time OCRs of differentiating FCs at 1 and 7 days (n = 10 per condition). Black arrows indicate timing of injection of the specified compounds. Data are shown as means ± SEM. Additional analyses are presented in fig. S2A. (I) Real-time extracellular acidification rates of differentiating FCs at 1 and 7 days (n = 4 per condition). Black arrows indicate timing of injection of the specified compounds. Data are shown as means ± SEM. Additional analyses are presented in fig. S2B.
