
Fig. 3. Mesenchymal features of differentiated human FCs.
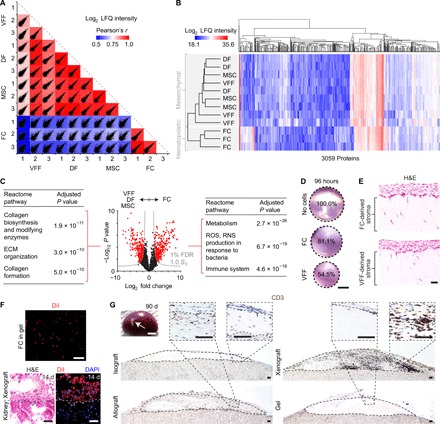
(A) Scatterplot matrix summarizing correlation analysis of log2 LFQ intensities (relative protein abundances) in FCs compared to MSCs, DFs, and VFFs (n = 3 per condition). Correlation coefficients corresponding to each scatterplot (calculated using Pearson’s r) are represented by the heatmap overlay. (B) Hierarchical clustering analysis of log2 LFQ intensities in all cell types (n = 3 per condition). (C) Volcano plot summarizing differential protein abundance across the two largest hierarchical clusters [FCs (hematopoietic origin) compared to MSCs, DFs, and VFFs (mesenchymal origin); n = 3 per condition]. Gray curves denote cutoff criteria, generated in Perseus; P values were calculated using Student’s t test. The tables list the top three Reactome pathway terms significantly enriched in the protein set overrepresented in MSCs, DFs, and VFFs (left) or FCs (right). Term lists were generated using Enrichr; P values were calculated using Fisher’s exact test with Benjamini-Hochberg adjustment. Additional enrichment data are presented in tables S2 and S3. (D) FC contractility in collagen matrix over 96 hours, compared to VFF and no-cell controls. Scale bar, 5 mm. (E) H&E-stained sections showing morphology of engineered mucosae generated using FCs or VFFs as the stromal cell source. Scale bar, 50 μm. (F) DiI-labeled, FC-derived engineered stromae in organotypic culture and 14 days after subrenal capsule xenoimplantation in rats. Scale bar, 50 μm. (G) CD3+ T cell infiltration of FC-derived engineered iso-, allo-, and xenografts, 90 days after implantation in rats. Dashed black contour lines indicate the boundary of each graft. Scale bars, 2 mm (gross specimen) and 50 μm (sections). ROS, reactive oxygen species; RNS, reactive nitrogen species.