
Fig. 4. Optimization of human FC yield.
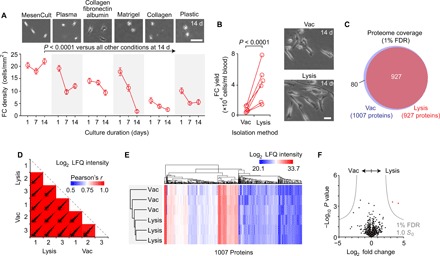
(A) Effect of culture substrate on FC yield. Data in the time-course plot are shown as means ± SEM. The P value was calculated using analysis of variance (ANOVA) (n = 4 to 12 per condition). The phase-contrast images show FC morphology at 14 days. Scale bar, 200 μm. (B) Effect of the PBMC isolation method [Vacutainer CPT (vac) versus ACK lysis (lysis) of red blood cells] on FC yield. The P value was calculated using Student’s t test (n = 6 per condition). The phase-contrast images show FC morphology at 14 days. Scale bar, 25 μm. (C) Venn diagram summarizing proteome coverage in FCs differentiated following vac or lysis (n = 3 per condition). (D) Scatterplot matrix summarizing correlation analysis of log2 LFQ intensities (relative protein abundances) in FCs differentiated following vac or lysis (n = 3 per condition). Correlation coefficients corresponding to each scatterplot (calculated using Pearson’s r) are represented by the heatmap overlay. (E) Hierarchical clustering analysis of log2 LFQ intensities in FCs differentiated following vac or lysis (n = 3 per condition). (F) Volcano plot summarizing differential protein abundance in FCs differentiated following vac or lysis (n = 3 per condition). Gray curves denote cutoff criteria, generated in Perseus; P values were calculated using Student’s t test.