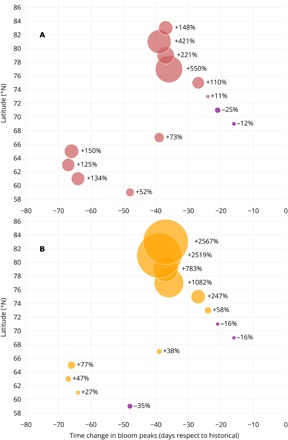
Fig. 3. Latitudinal changes in sea-ice annual GPP.

The percentage changes in the magnitude of sea-ice GPP are shown as a function of latitude and differences in the timing of the bloom peak. This indicator is the difference between the RCP8.5 scenario (2061–2100) and the historical simulations (1961–2005), scaled by the historical value. (A) Percentage change in annual sea-ice GPP per unit area (red bubbles), i.e., integrated temporally along the ice season length. (B) Percentage change in annual sea-ice GPP integrated both temporally along the ice season length and spatially over the ice extent of each simulation period (yellow bubbles). The area of the bubbles is proportional to the percentage change.
