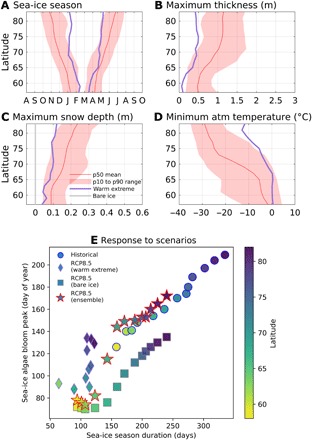
Fig. 6. Uncertainties in the future projections of sea-ice drivers and simulated responses of algal phenology.

Spread of the sea-ice driver projections and extreme cases for (A) ice season duration, (B) maximum sea-ice thickness, (C) maximum snow depth, (D) minimum near-surface air temperature. The lines are the ensemble means of empirical density distribution medians (50th percentile as in Fig. 2) for the RCP8.5 scenario (2061–2100) simulations. The shaded areas indicate the interval between the ensemble means of the 10th and 90th percentiles from the same distributions. The purple lines show the sea-ice drivers derived from the extreme warm scenario. The bare ice scenario is identical to the ensemble mean except for the snow depth set to zero [gray line in (C)]. (E) The resulting ice algae phenology, expressed as the day of bloom peak (y axis) under different scenarios (historical, ensemble RCP8.5, ensemble RCP8.5 for bare ice experiment, and RCP8.5 of the warmest extreme among models) and as a function of sea-ice season duration (x axis) for all the simulations and latitudinal bands.
