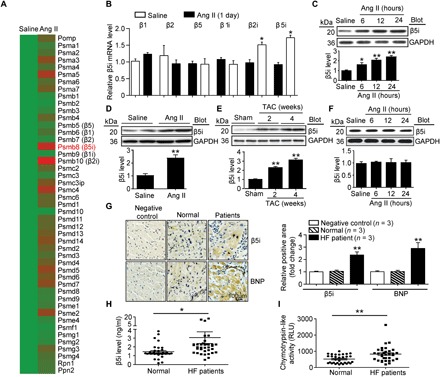
Fig. 1. β5i is increased in hypertrophic hearts and HF patients.

(A) Cluster of the proteasome gene expression profiles in saline- or Ang II–infused mouse heart at day 1 (n = 3 samples per group). (B) qPCR analyses of β1, β2, β5, β1i, β2i, and β5i mRNA expression in saline- or Ang II–infused mouse heart at day 1 and control (n = 3 per group). (C) Protein levels of β5i in NRCMs exposed to Ang II (100 nM) at different time points (top) and quantification (bottom, n = 3). (D and E) Protein levels of β5i in WT hearts after 2 or 4 weeks of Ang II infusion (1000 ng/kg per min) or TAC operation (top) and quantification (bottom, n = 3). (F) Neonatal rat fibroblasts were treated with Ang II for 0 to 24 hours. The β5i protein expression was examined by Western blot analysis (top) and quantification of the relative protein levels (bottom, n = 3). (G) Representative immunohistochemical staining of β5i and BNP proteins in the heart tissues from normal control and HF patients (left). Quantification of β5i- and BNP-positive areas (right, n = 3). (H and I) β5i level and chymotrypsin-like activity in blood samples of normal controls (n = 38) and HF patients (n = 38). Data are presented as means ± SEM, and n represents the number of samples per group. *P < 0.05 and **P < 0.01 versus saline, sham, or normal control. RLU, relative luciferase units.
