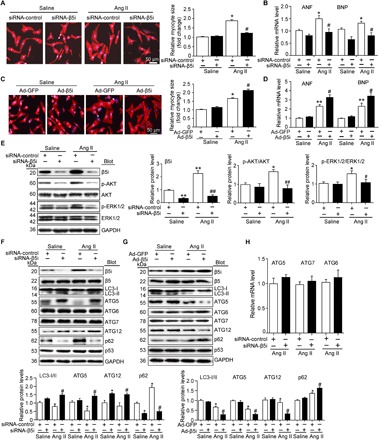
Fig. 2. Knockdown of β5i inhibits cardiomyocyte hypertrophy and activates autophagy.

(A) Representative images of double immunostaining [green for α-actinin and blue for 4′,6-diamidino-2-phenylindole (DAPI)] of NRCMs transfected with Ad-siRNA-β5i or siRNA-control after Ang II stimulation. Quantification of cell surface area (at least 150 cells counted per experiment; right). (B) qPCR analyses of ANF and BNP mRNA expression (right, n = 5). (C) Immunostaining of cardiomyocyte size with α-actinin (red) and DAPI (blue) infected with Ad-GFP or Ad-β5i after Ang II stimulation. Quantification of cell surface area (at least 150 cells counted per experiment; right). (D) qPCR analyses of ANF and BNP mRNA expression (right, n = 5). (E) Protein levels of β5i, p-AKT, AKT, p-ERK1/2, and ERK1/2 in NRCMs treated as in (A) and quantification (n = 3). (F) Protein levels of β5i, LC3, ATG5, ATG6, ATG7, ATG12, p62, and p53 in NRCMs infected with scrambled siRNA-control or siRNA-β5i after Ang II treatment (top) and quantification (bottom, n = 3). (G) Protein levels of β5i, LC3, ATG5, ATG6, ATG7, ATG12, p62, and p53 in NRCMs infected with Ad-GFP control or Ad-β5i after Ang II treatment (top) and quantification (bottom, n = 3). (H) qPCR analysis of autophagy-related genes ATG5, ATG7, and ATG6 (Beclin-1) and mRNA levels in primary cardiomyocytes infected with siRNA-control or siRNA-β5i after Ang II treatment (n = 3). Data are presented as means ± SEM, and n represents the number of samples. For (A), (B), (E), and (F), *P < 0.05 and **P < 0.01 versus siRNA-control + saline; #P < 0.05 and ##P < 0.01 versus siRNA-control + Ang II. For (C), (D), and (G), *P < 0.05 and **P < 0.01 versus Ad-GFP + saline; #P < 0.05 versus Ad-GFP + Ang II.
