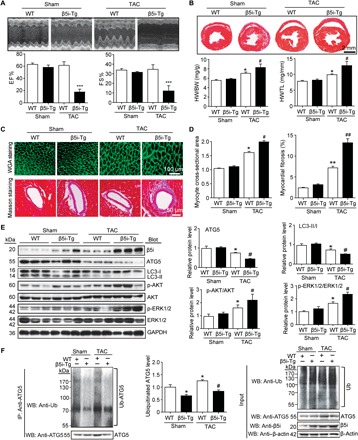
Fig. 6. Cardiac-specific overexpression of β5i aggravates pressure overload–induced cardiac hypertrophy.

WT and β5i-Tg mice were subjected to sham or TAC operation for 3 weeks. (A) Representative M-mode echocardiography of the left ventricle (top). Measurement of EF% and FS% (bottom, n = 5). (B) Hematoxylin and eosin staining of heart sections and HW/BW and HW/TL ratios (bottom, n = 5). (C) Cardiac myocyte size and fibrosis were detected by FITC-labeled WGA staining (top) and Masson’s trichrome staining (bottom). Scale bar, 100 μm. (D) Quantification of the relative myocyte cross-sectional area (200 cells counted per heart, left) and fibrotic area (right, n = 5). (E) Protein levels of β5i, ATG5, LC3, p-AKT, AKT, p-ERK1/2, and ERK1/2 in the heart tissues (left) and quantification (right, n = 5). (F) Lysates from WT and β5i-Tg mice heart after 3 weeks of sham or TAC were immunoprecipitated with anti-ATG5 antibody. Western blot analysis of ubiquitin-conjugated ATG5 (left). Quantification of the relative ubiquitinated ATG5 level (middle, n = 3) and input of each protein (right). Data are presented as means ± SEM, and n represents the number of animals per group. *P < 0.05 and **P < 0.01 versus WT + sham; #P < 0.05 and ##P < 0.01 versus WT + TAC.
