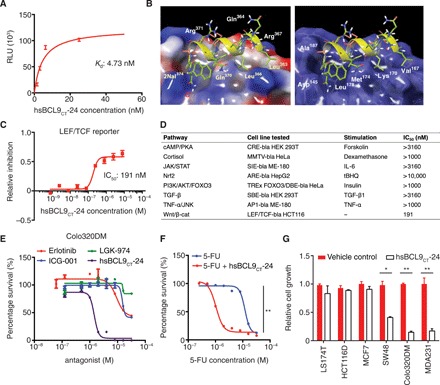
Fig. 1. In vitro profiling of hsBCL9CT-24.

(A) Customized ALPHA assay detecting protein binding interactions between biotinylated hsBCL9CT-24 and His-tagged β-cat. RLU, relative luciferase units. (B) Docking hsBCL9CT-24 into the β-cat hydrophobic pocket (Protein Data Bank: 3SL9) performed by GlideXP Maestro Schrodinger. In the left panel, green labels represent hydrophobic binding sites, while white labels denote hydrophilic amino acids. In the right panel, white labels illustrate amino acids in the β-cat hydrophobic pocket. (C) β-cat reporter assay conducted in LEF/TCF-bla HCT116 cells (Ser45 deletion in one allele of the CTNNB1 gene) treated with hsBCL9CT-24 (IC50 = 191 nM). (D) Table summarizing reporter assay results, denoting hsBCL9CT-24’s specificity in Wnt/β-cat inhibition (IC50 = 191 nM) and lack of off-target effects in other signaling cascades (IC50 > 1000 nM for all). (E) Dose-response curves showing inhibitory effects of the indicated molecules on growth of the Colo320DM cell line: hsBCL9CT-24 (IC50 = 1.45 μM) compared to ICG-001 (IC50 = 15.03 μM), LGK-974 (IC50 = 18.46 μM), and erlotinib (IC50 = 10 μM). (F) Dose-response curves showing Colo320DM cells treated with 5-fluorouracil (5-FU) or 5-FU combined with 2 μM hsBCL9CT-24. Addition of 2 μM hsBCL9CT-24 lowered the IC50 of 5-FU from 12.1 μM to 1 μM. **P < 0.01, two-way analysis of variance (ANOVA). (G) BrdU cell proliferation assay of colon cancer lines (LS174T, HCT116D, SW48, and Colo320DM) and breast cancer cell lines (MDA231 and MCF7) treated with 8 μM hsBCL9CT-24 over 24 hours. *P < 0.05, **P < 0.01, unpaired Student’s t test. Results were denoted as means ± SEM for assays performed in triplicate and repeated twice.
