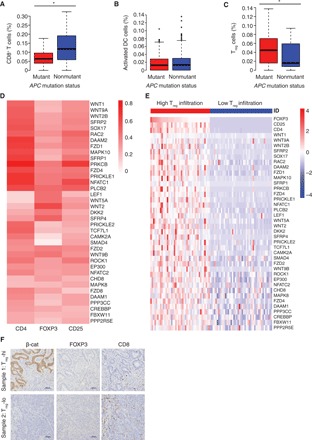
Fig. 3. Activation of the Wnt pathway is associated with Treg cell infiltration in human CRC.

The correlation between infiltration of (A) CD8+ T cells, (B) activated DCs, and (C) Treg cells and APC gene mutation status in human CRC samples was analyzed by CIBERSORT (*P < 0.05). (D) Relative heat map of expression correlation between CD4, CD25, and FOXP3 with a subset of Wnt pathway genes in 287 colon cancer tumors. (E) Relative heat map of Wnt pathway gene expression in colon cancer tumors stratified by Treg cell infiltration level [Treg-hi (CD4-hi CD25-hi FOXP3-hi) versus Treg-lo (CD4-lo CD25-lo FOXP3-lo)]. High infiltration is denoted by the top quartile, while low infiltration is composed of the bottom quartile of the 287 tumors. Each column represents one sample, with samples arranged according to FOXP3 expression level. (F) IHC staining for β-cat, FOXP3, and CD8 in two representative human CRC samples.
