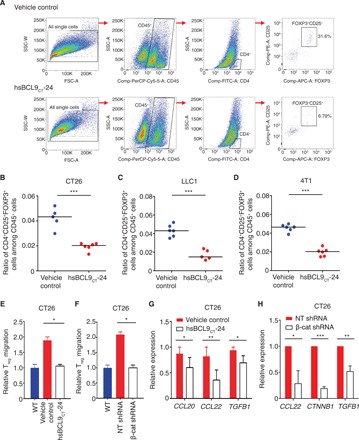
Fig. 4. hsBCL9CT-24 reduces Treg cell infiltration by inhibition of CCL20 and CCL22 in cancer.

(A) BALB/c mice inoculated with CT26 tumors were treated with vehicle control or hsBCL9CT-24 (20 mg/kg) via i.p. injection, QD over 14 days. Representative flow panels of CD4+CD25+FOXP3+ T cells (Treg) are shown. (B) Ratio of CD4+CD25+FOXP3+ cells among the CD45+ cell populations in the tumors from (A) (***P < 0.001). Mice bearing (C) LLC1 tumors or (D) 4T1 tumors were treated with vehicle control or hsBCL9CT-24 (20 mg/kg) via i.p. injection, QD over 14 days. Percentages of CD25+FOXP3+ Treg cells among the CD45+ cell populations in the respective tumors are shown (***P < 0.001). (E) Migration of freshly isolated Treg cells cocultured with CT26 cells pretreated with or without hsBCL9CT-24 (5 μM) for 24 hours (*P < 0.05). (F) Migration of freshly isolated Treg cells cocultured with CT26 cells transduced with NT shRNA or β-cat shRNA (*P < 0.05). WT, wild type. (G) qRT-PCR measurement of CCL20 (*P < 0.05), CCL22 (**P < 0.01), and TGFB1 (*P < 0.05) in CT26 cells treated with or without hsBCL9CT-24 (5 μM) for 24 hours. (H) qRT-PCR measurement of CCL22 (*P < 0.05), CTNNB1 (***P < 0.001), and TGFB1 (**P < 0.01) expression in CT26 cells transduced with NT shRNA or β-cat shRNA. Results were denoted as means ± SEM for experiments performed in triplicate. Each experiment was repeated twice, and the statistical significance of differences between groups was determined by unpaired Student’s t test.
