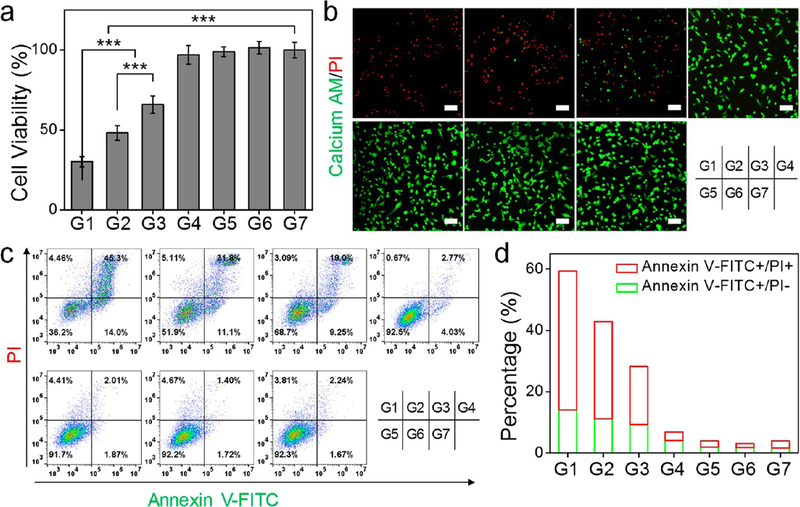
Figure 7.
In vitro evaluation of synergistic PTT-enhanced CO gas therapy on U87MG cells. Seven experimental groups were studied, with two 808 nm irradiation doses (1.0 W/cm2 for 3 min or 0.3 W/cm2 for 12 min). G1, HMOPM-CO + 1.0 W/cm2 (synergistic PTT/gas therapy group). G2, HMOPM + 1.0 W/cm2 (PTT group). G3, HMOPM-CO + 0.3 W/cm2 (gas therapy group). G4, HMOPM + 0.3 W/cm2. G5, HMOPM-CO. G6, + 1.0 W/cm2. G7, PBS. (a) MTT assays. (b) Live and dead assays. Green, Calcein AM, live cells. Red, PI, dead cells. Scale bar, 100 μm. (c) Flow cytometry analysis on apoptotic/necrotic cells via Annexin V-FITC/PI assays. (d) Quantitative analysis of corresponding cell apoptosis/ necrosis percentages based on (c). The synergistic PTT/gas therapy significantly improved the treatment efficacy. *** P < 0.001.

