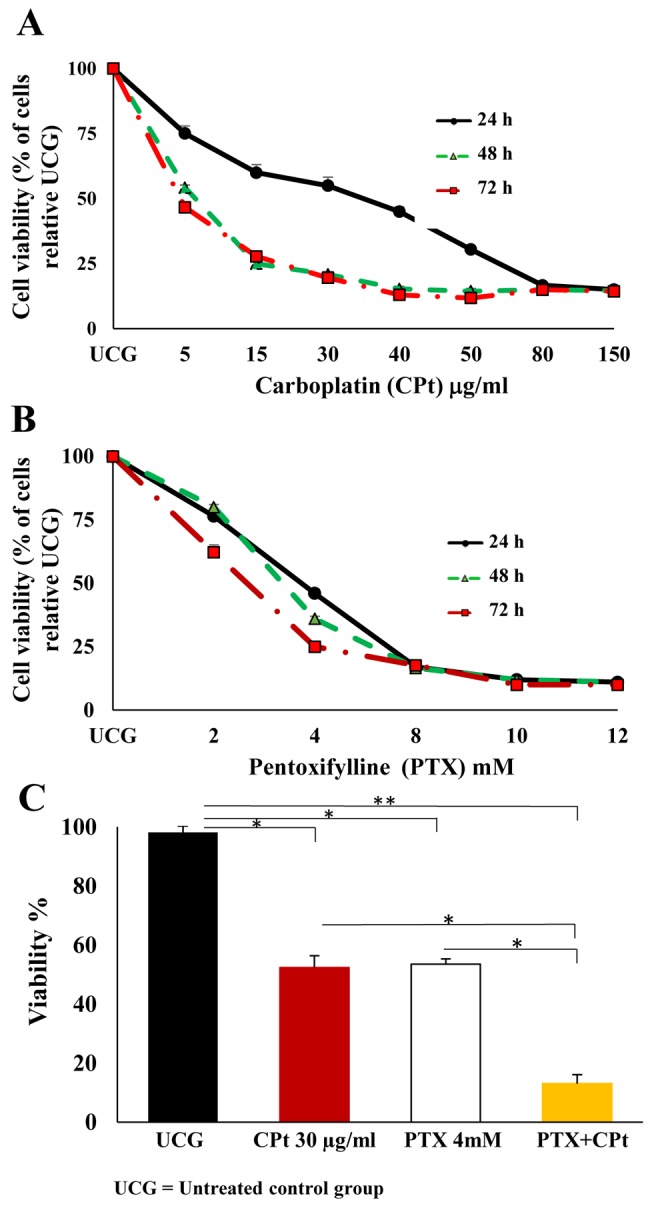
Figure 1. Cell viability of Y79 RB cells treated with carboplatin (CPt)(A) and pentoxifylline (PTX) (B) at different doses and for different amounts of time. The effects of CPt, PTX, and PTX and CPt combined on cell viability (C) are expressed as a percentage of non-viable cells in comparison with the untreated control group (UCG) considered as 100%. The results are presented as means±standard deviation. **p<0.001 (PTX+CPt compared to the UCG), *p<0.05 (CPt and PTX alone groups compared to the UCG, and PTX+CPt treated group compared to the CPt and PTX groups).

