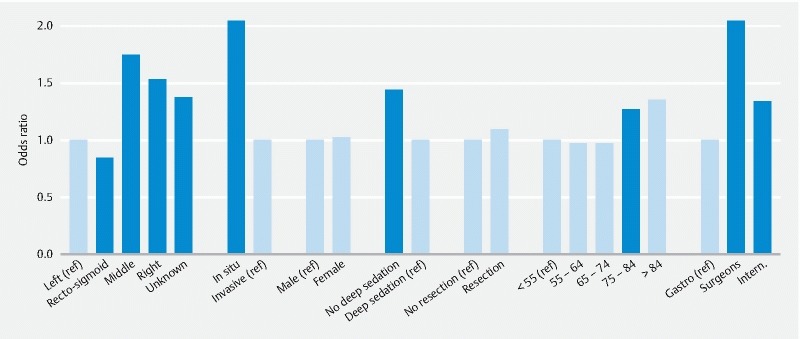
Fig. 3.

Bar chart of PCCRC rate according to patient, procedure, and tumor characteristics. Black bars indicate groups that differ significantly from the reference groups. Reference groups are defined as groups with the lowest a priori expected PCCRC (so the expected odds ratios are greater than 1).
