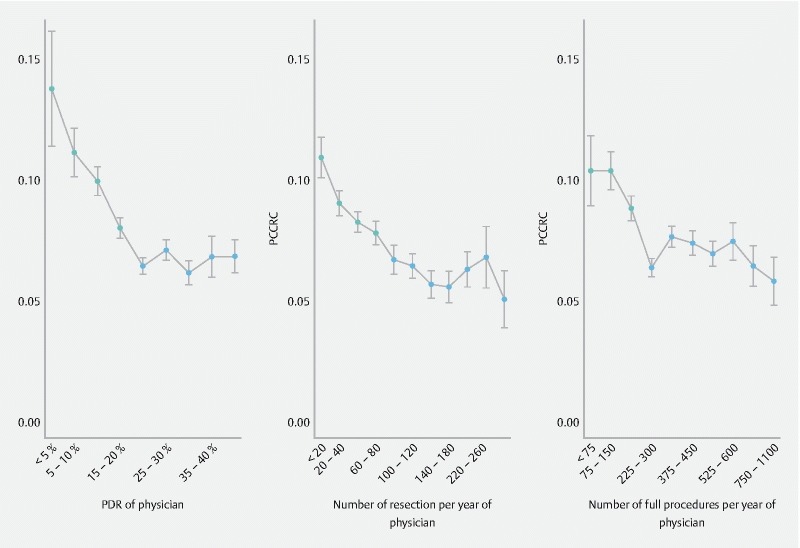
Fig. 4.

Differences in PCCRC rates among physicians with: left panel: different polyp detection rates (PDR); middle panel: different numbers of resections performed on a yearly basis; right panel: different numbers of full procedures performed on a yearly basis. Mean PCCRC (SE) rates indicated in gray differ significantly from those indicated in black, supporting a significantly higher PCCRC rate for physicians with PDR below 20 % (left panel), with less than 80 resections performed per year (middle panel), and with less than 225 full procedures performed per year (right panel).
