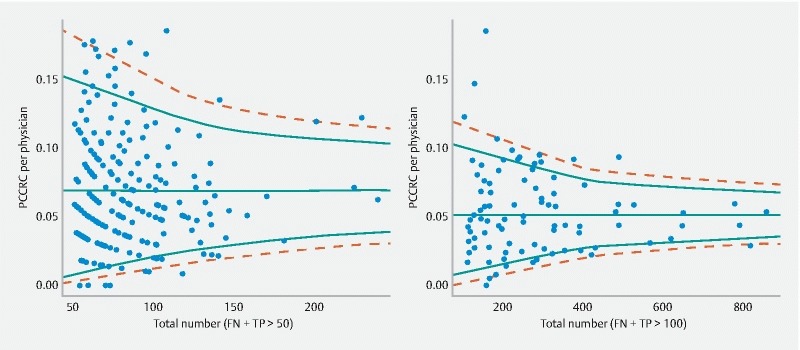
Fig. 5.

Funnel graph of: left panel: between-physician variation in PCCRC rates for physicians with more than 50 colonoscopies (TP + FN) (χ 2 = 476, degrees of freedom = 215, P < 0.0001); right panel: between-hospital variation in PCCRC rates for hospitals with more than 100 colonoscopies (TP + FN) (χ 2 = 288, degrees of freedom = 91, P < 0.0001). Solid and dashed lines reflect 95 % and 99 % prediction bands, respectively. The horizontal line represents the average PCCRC rate across all physicians (left) or hospitals (right).
