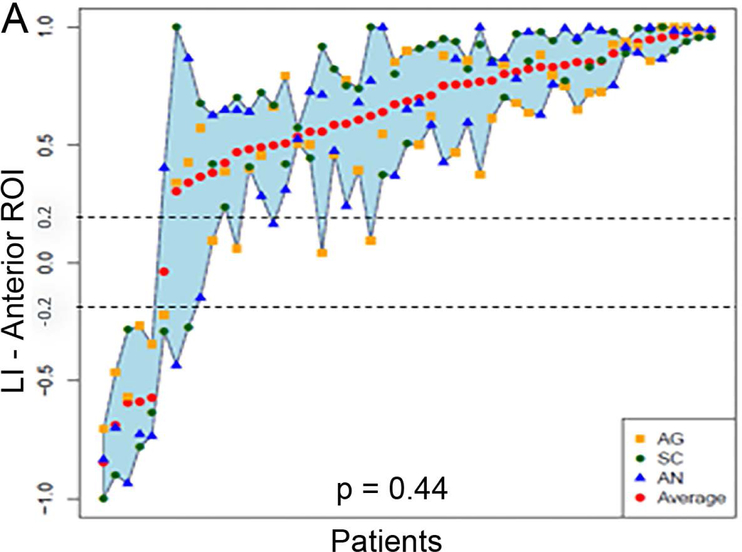
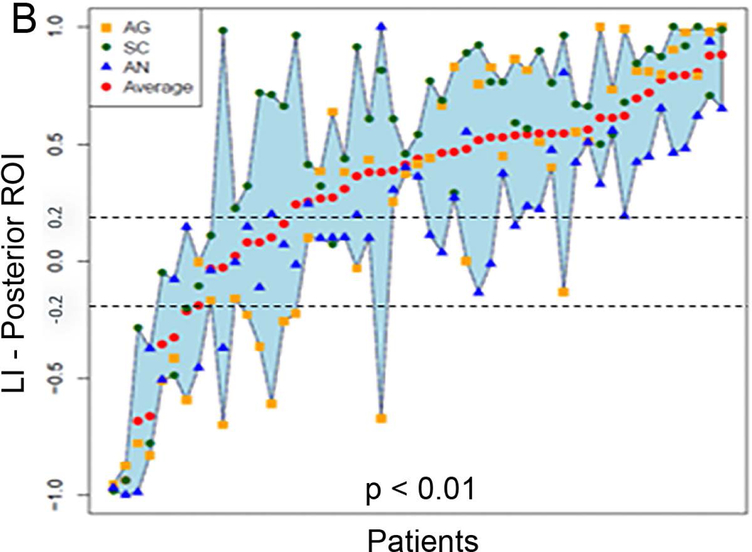
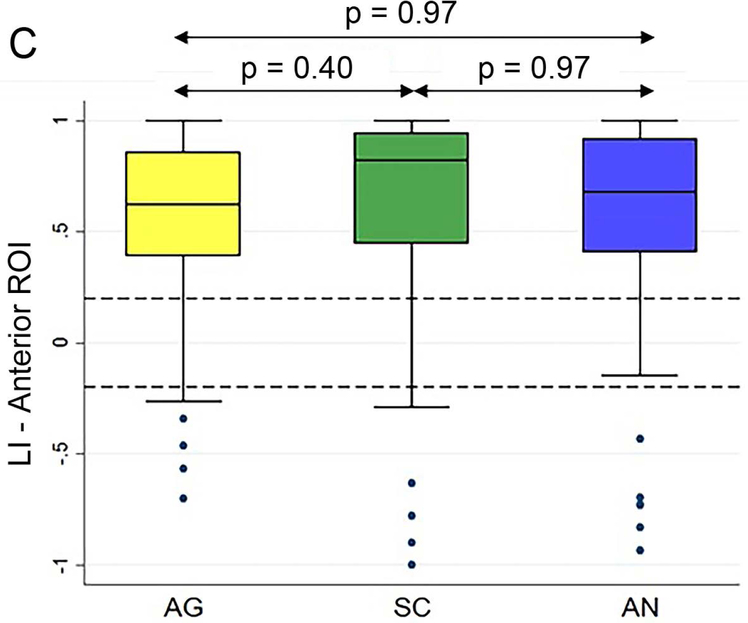
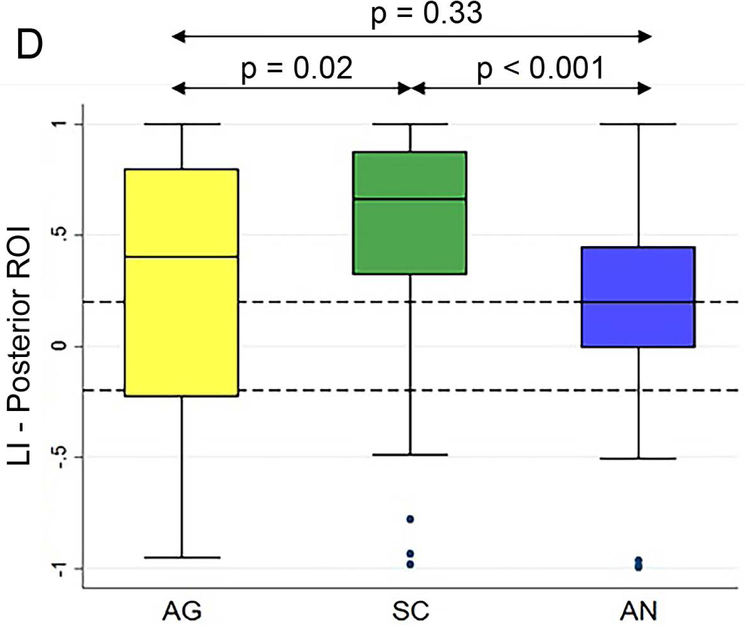
Figure 5.
Laterality index results of all patients’ individual tasks’ data and the box plots of the three tasks’ LIs within the anterior and posterior language regions-of-interest. (A and B) For the anterior and posterior language regions-of-interest (ROIs), the laterality index (LI) averaged across the three tasks (red dots) for each patient are plotted and arranged from the lowest to the highest LI. (C and D) The box plots of the three tasks’ LIs within the anterior and posterior language ROIs. The dotted lines represent the LI cut-offs for hemispheric lateralization for language function (LI > 0.2, left lateralized; −0.2 < LI < 0.2, bilateral; LI < −0.2, right lateralized). AG: antonym generation task; SC: sentence completion task; AN: auditory naming task.


