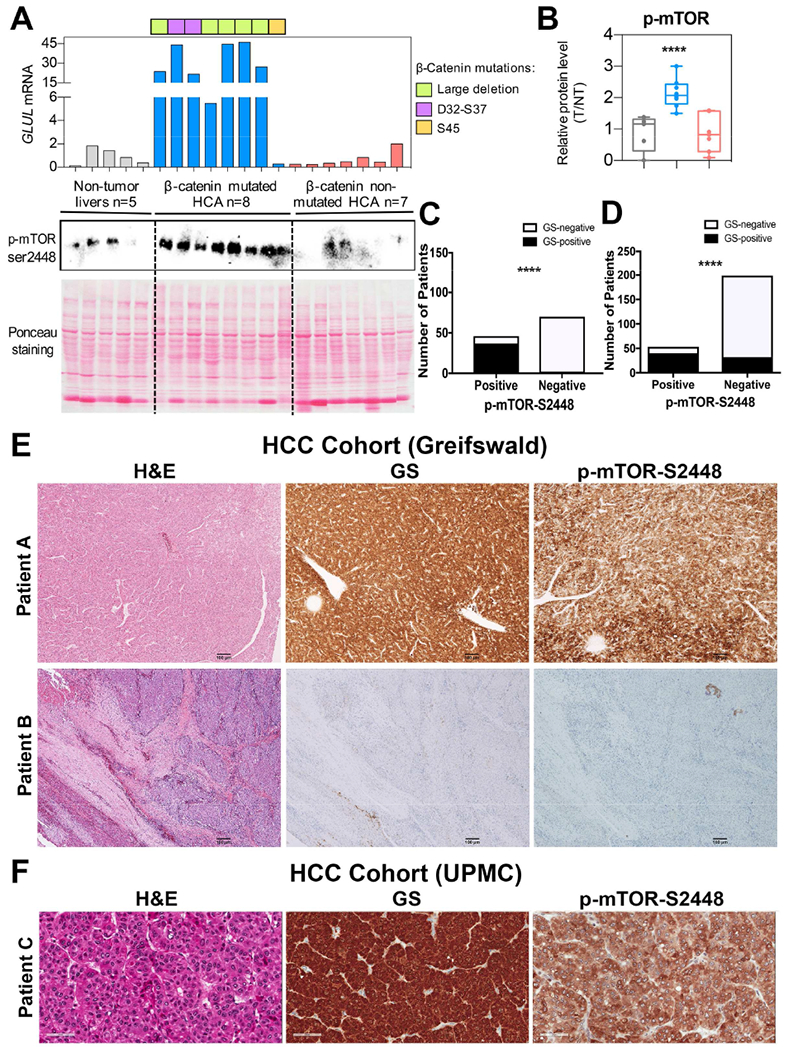
Figure 2: Human liver tumors with CTNNB1 mutations and/or GS upregulation show significant increase in p-mTOR-S2448.

A. Levels of p-mTOR-S2448 were dramatically increased in CTNNB1-mutated HCA (blue) as compared to adjacent non-tumor livers (gray) and CTNNB1 non-mutated HCA (red) by WB. Ponceau staining confirmed comparable protein loading. GLUL mRNA expression was assessed by qRT-PCR and showed increased expression in CTNNB1-mutated HCA with different mutations/deletions in CTNNB1 noted with different colors.
B. For each sample, expression level of each protein was quantified using Image Lab software (Bio-Rad). Kruskall-Wallis and Mann-Whitney test were used to assess differences between groups and showed significant increase in p-mTOR-S2448 in CTNNB1-mutated HCA as compared to other groups (****p=0.0002).
C. 32% (n=37) of all HCC cases (n=116) at the University of Greifswald cohort were simultaneously positive for GS and p-mTOR-S2448. Bar graph representing Fisher’s exact test showed a significant correlation between GS and p-mTOR-S2448 staining in these samples (****p=2.34E-19; 2-sided test).
D. 16% (n=40) of the 252 usable cases represented on 6 TMAs representing the UPMC cohort, were simultaneously positive for GS and p-mTOR-S2448 while 169 cases were negative for both these markers. Fisher’s exact test showed a significant correlation between GS and p-mTOR-S2448 (****p=4.26E-17, 2-sided test).
E. Representative IHC of HCC samples from the University of Greifswald cohort showing simultaneous positivity (Patient A) or negativity (Patient B) for GS and p-mTOR-S2448 (50×).
F. Representative IHC of HCC samples from the UPMC cohort TMA showing simultaneous positivity (Patient C) for GS and p-mTOR-S2448 (100×).
See also Figures S1, S2, S3 and S7 and Tables S1, S2 and S3.
